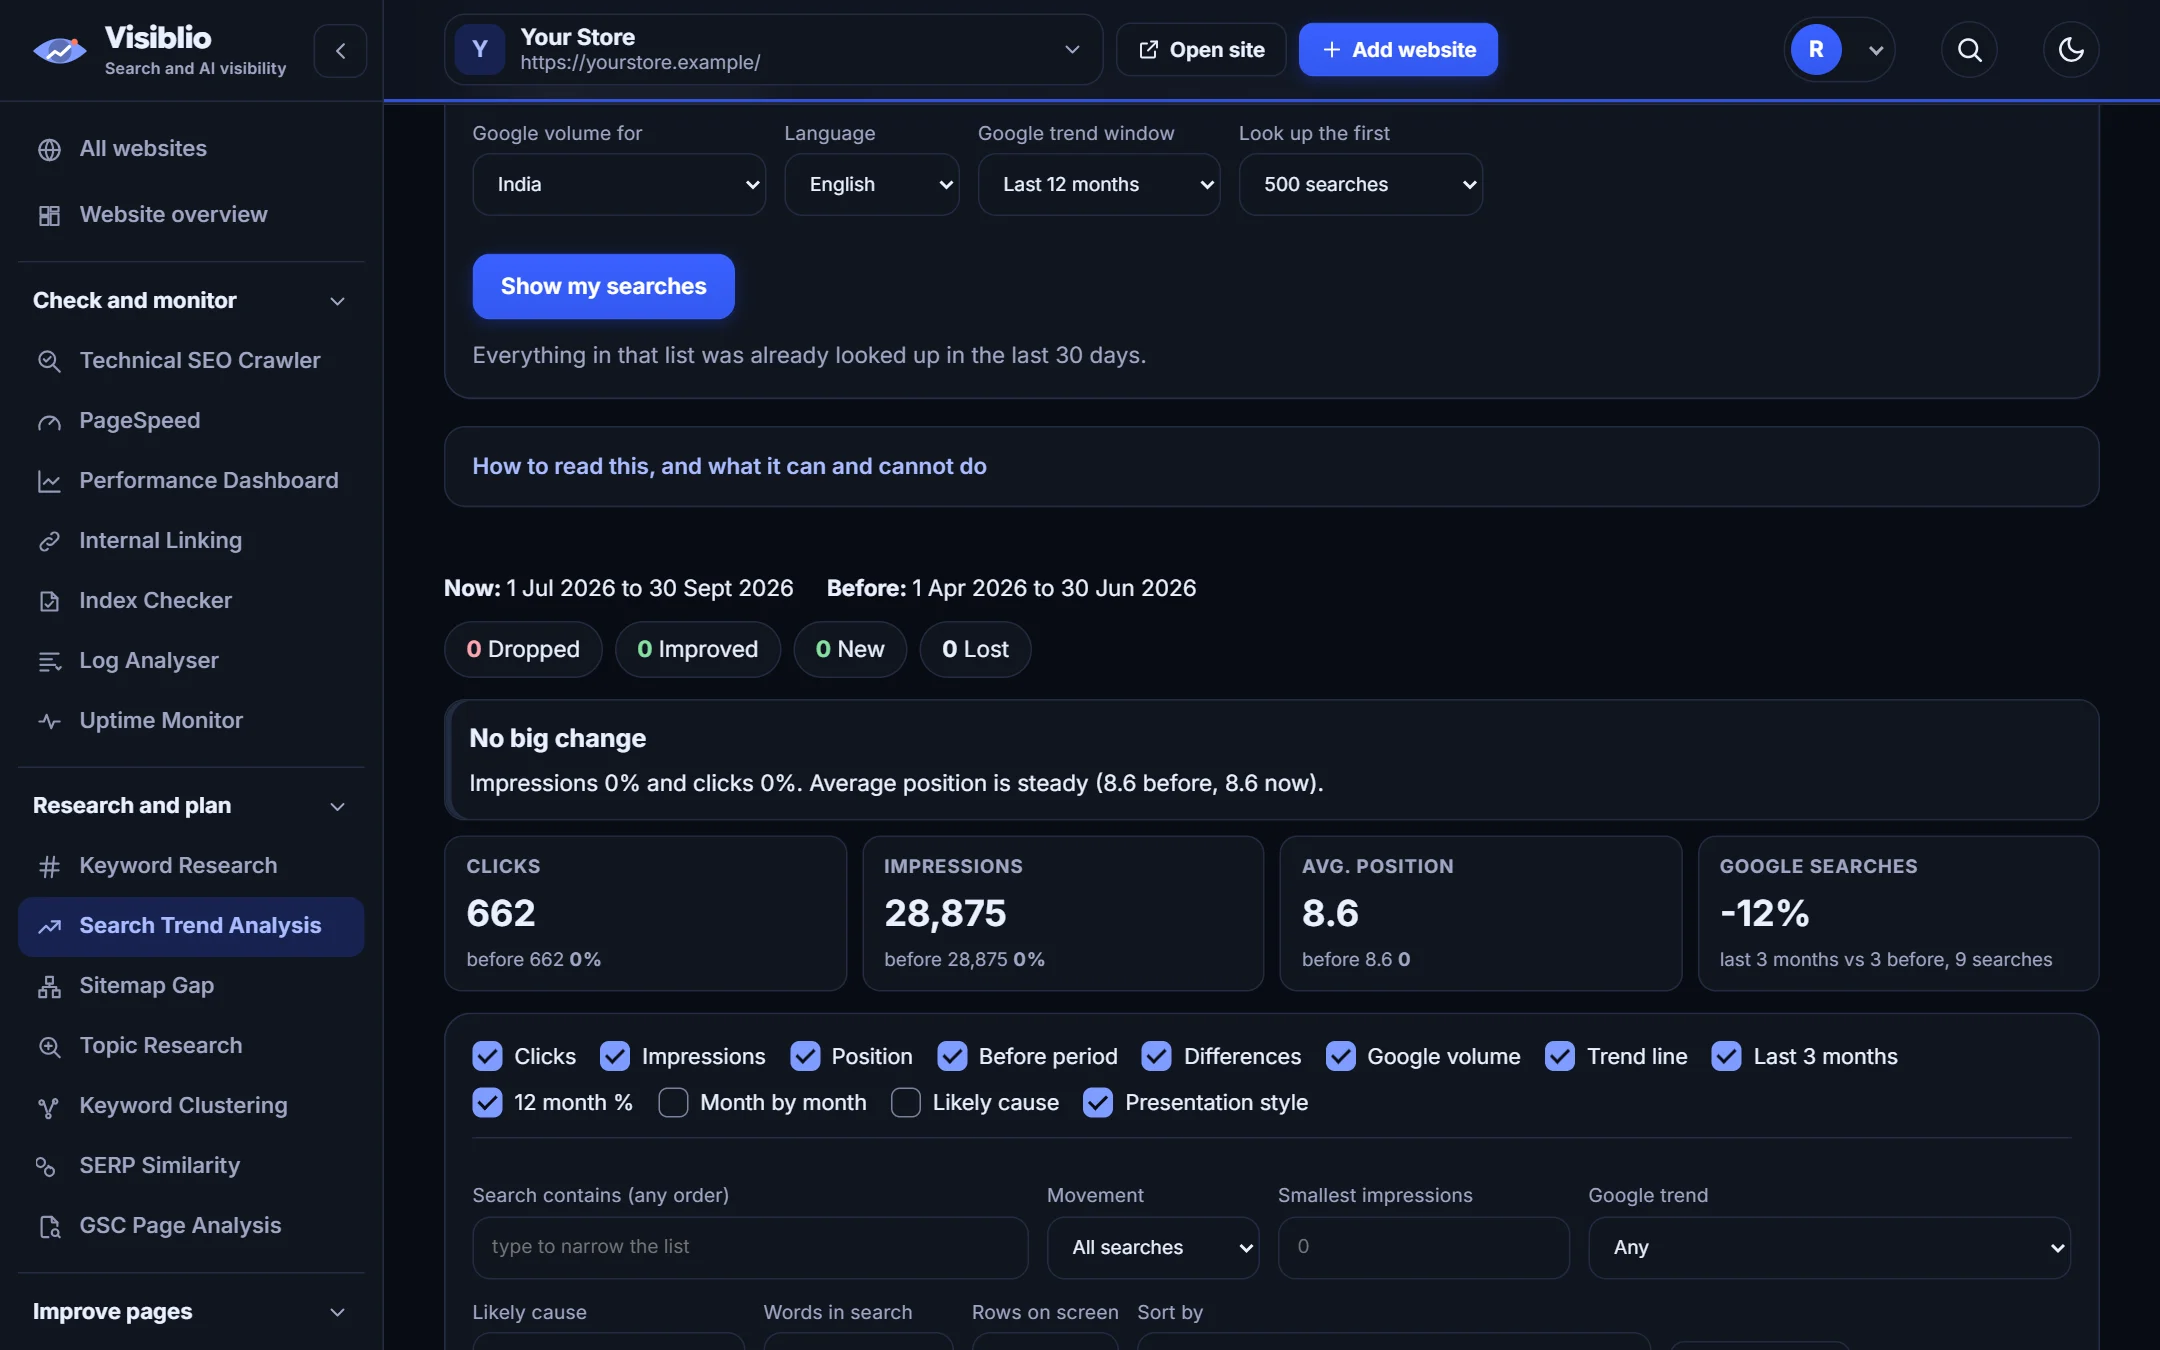
Every query, now against before
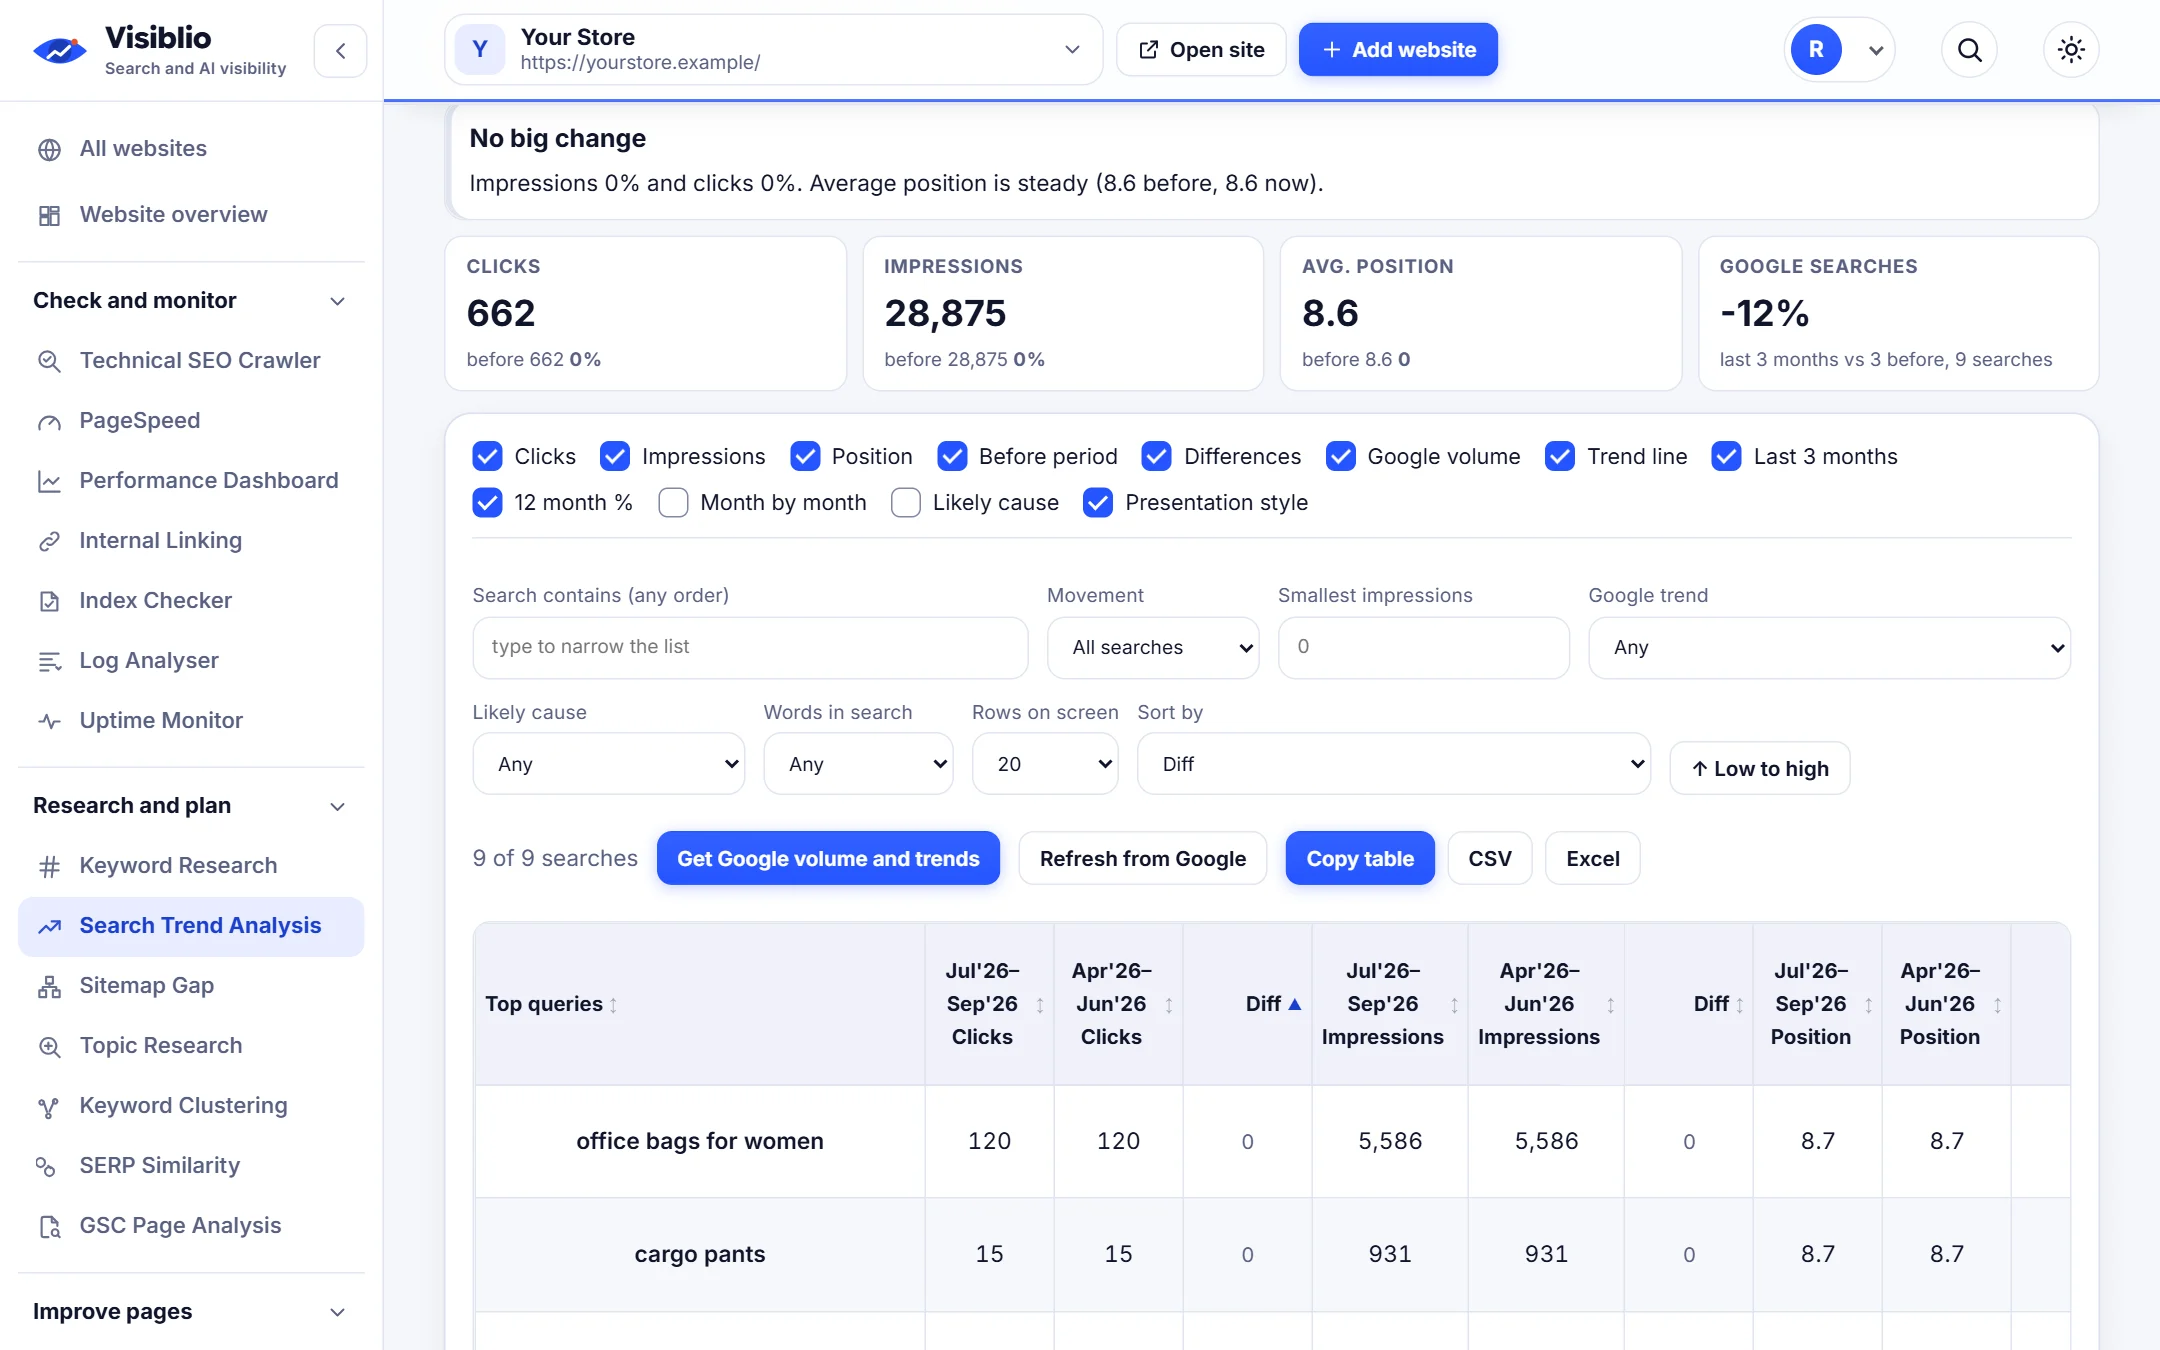
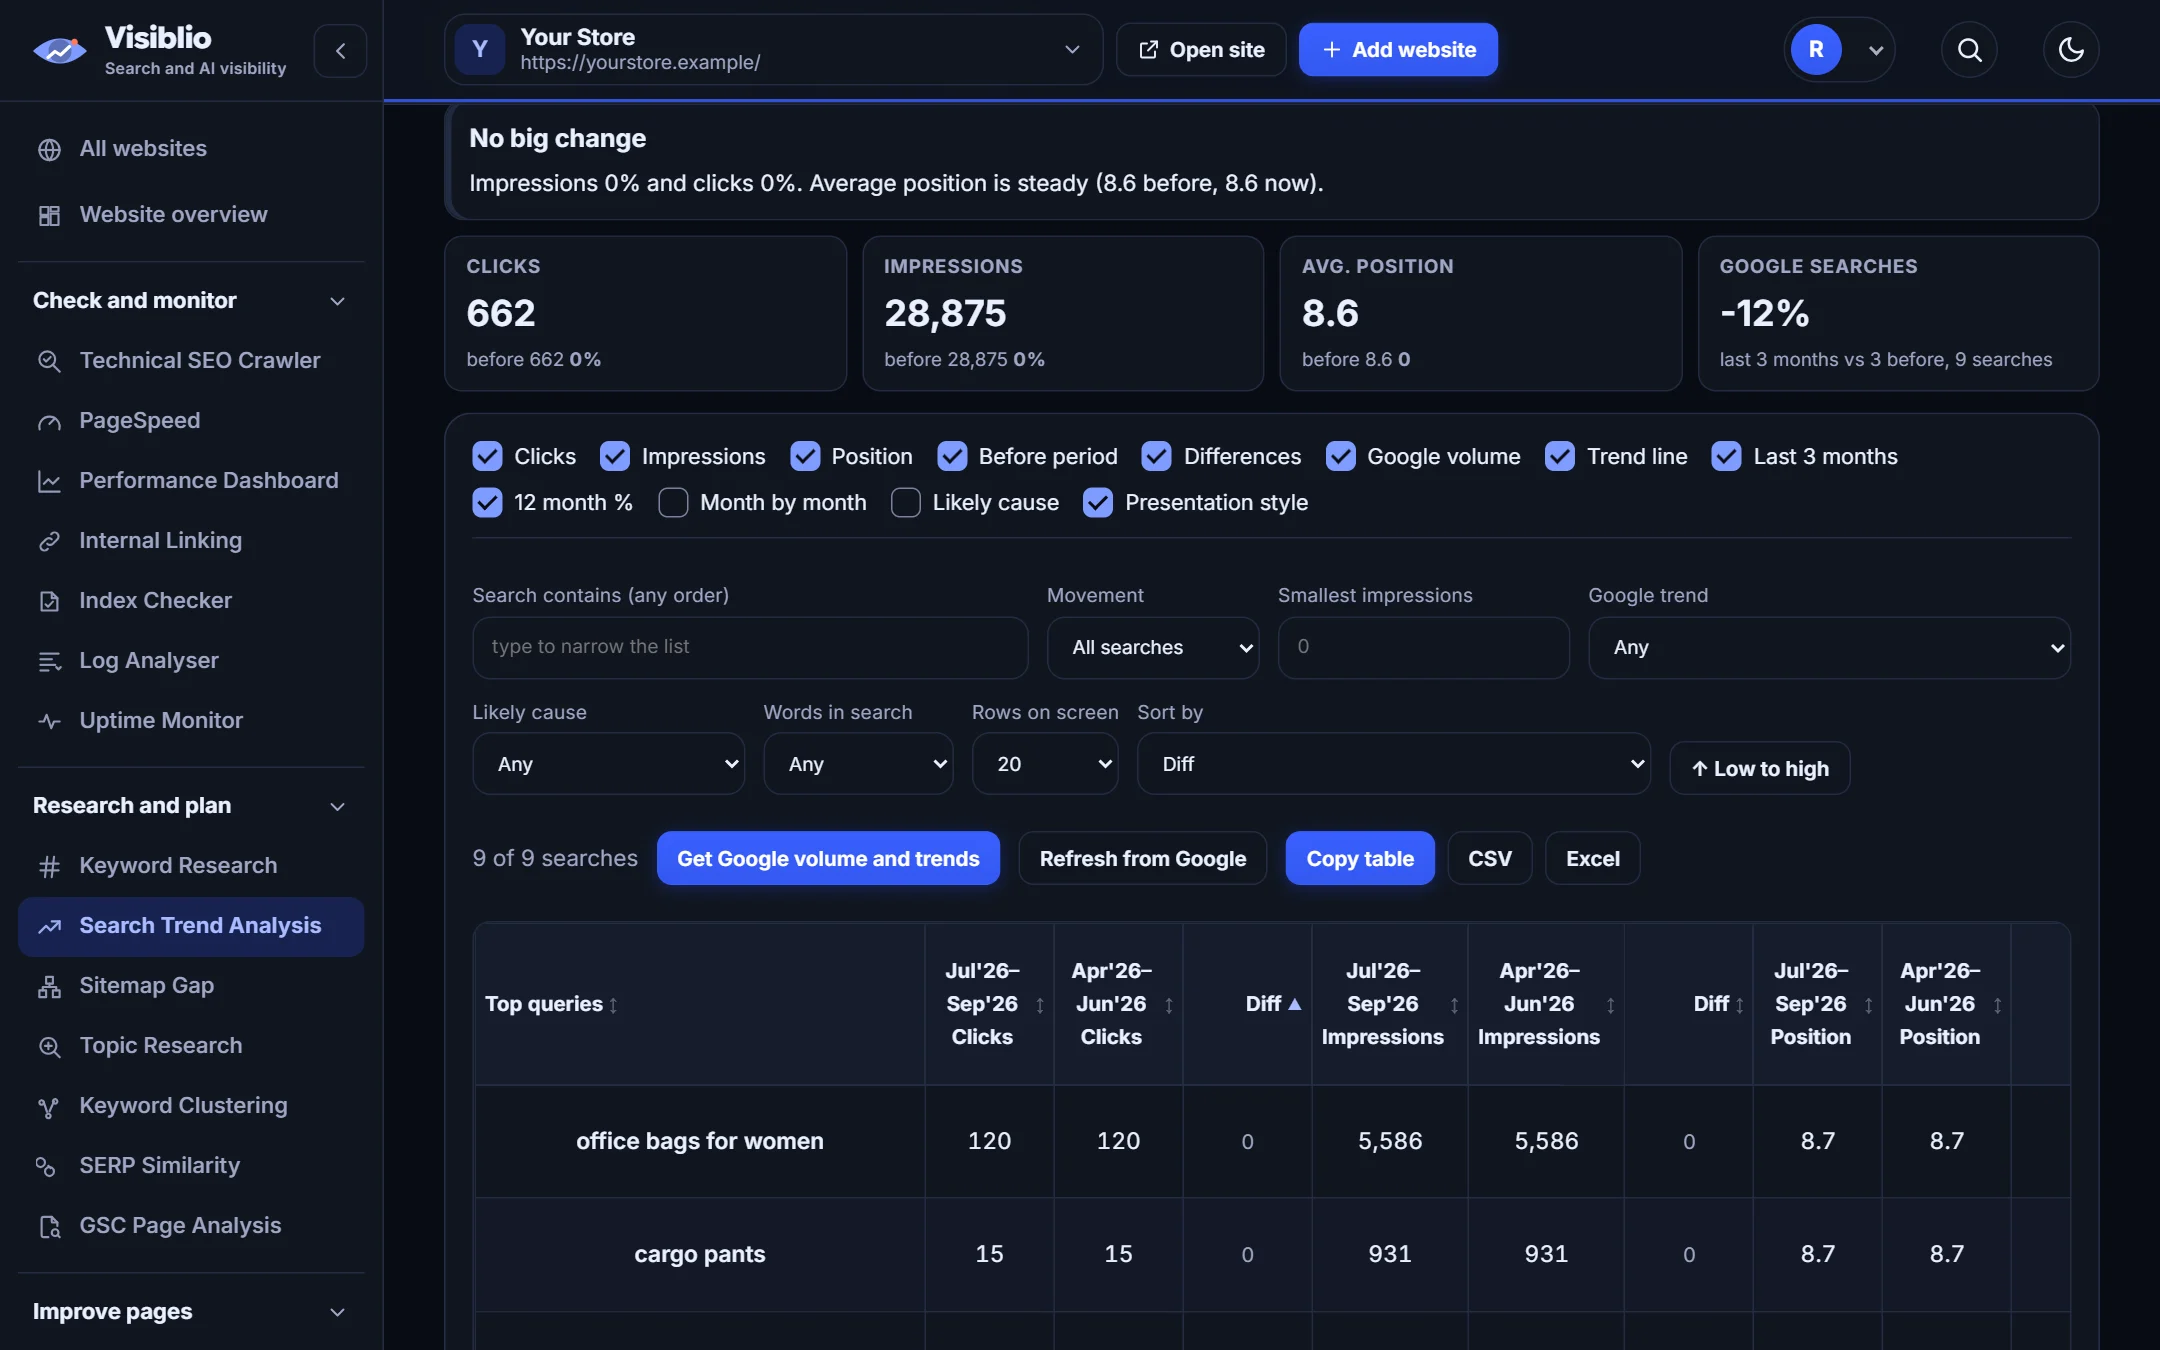
A sortable table of queries with the change in each metric between two periods.
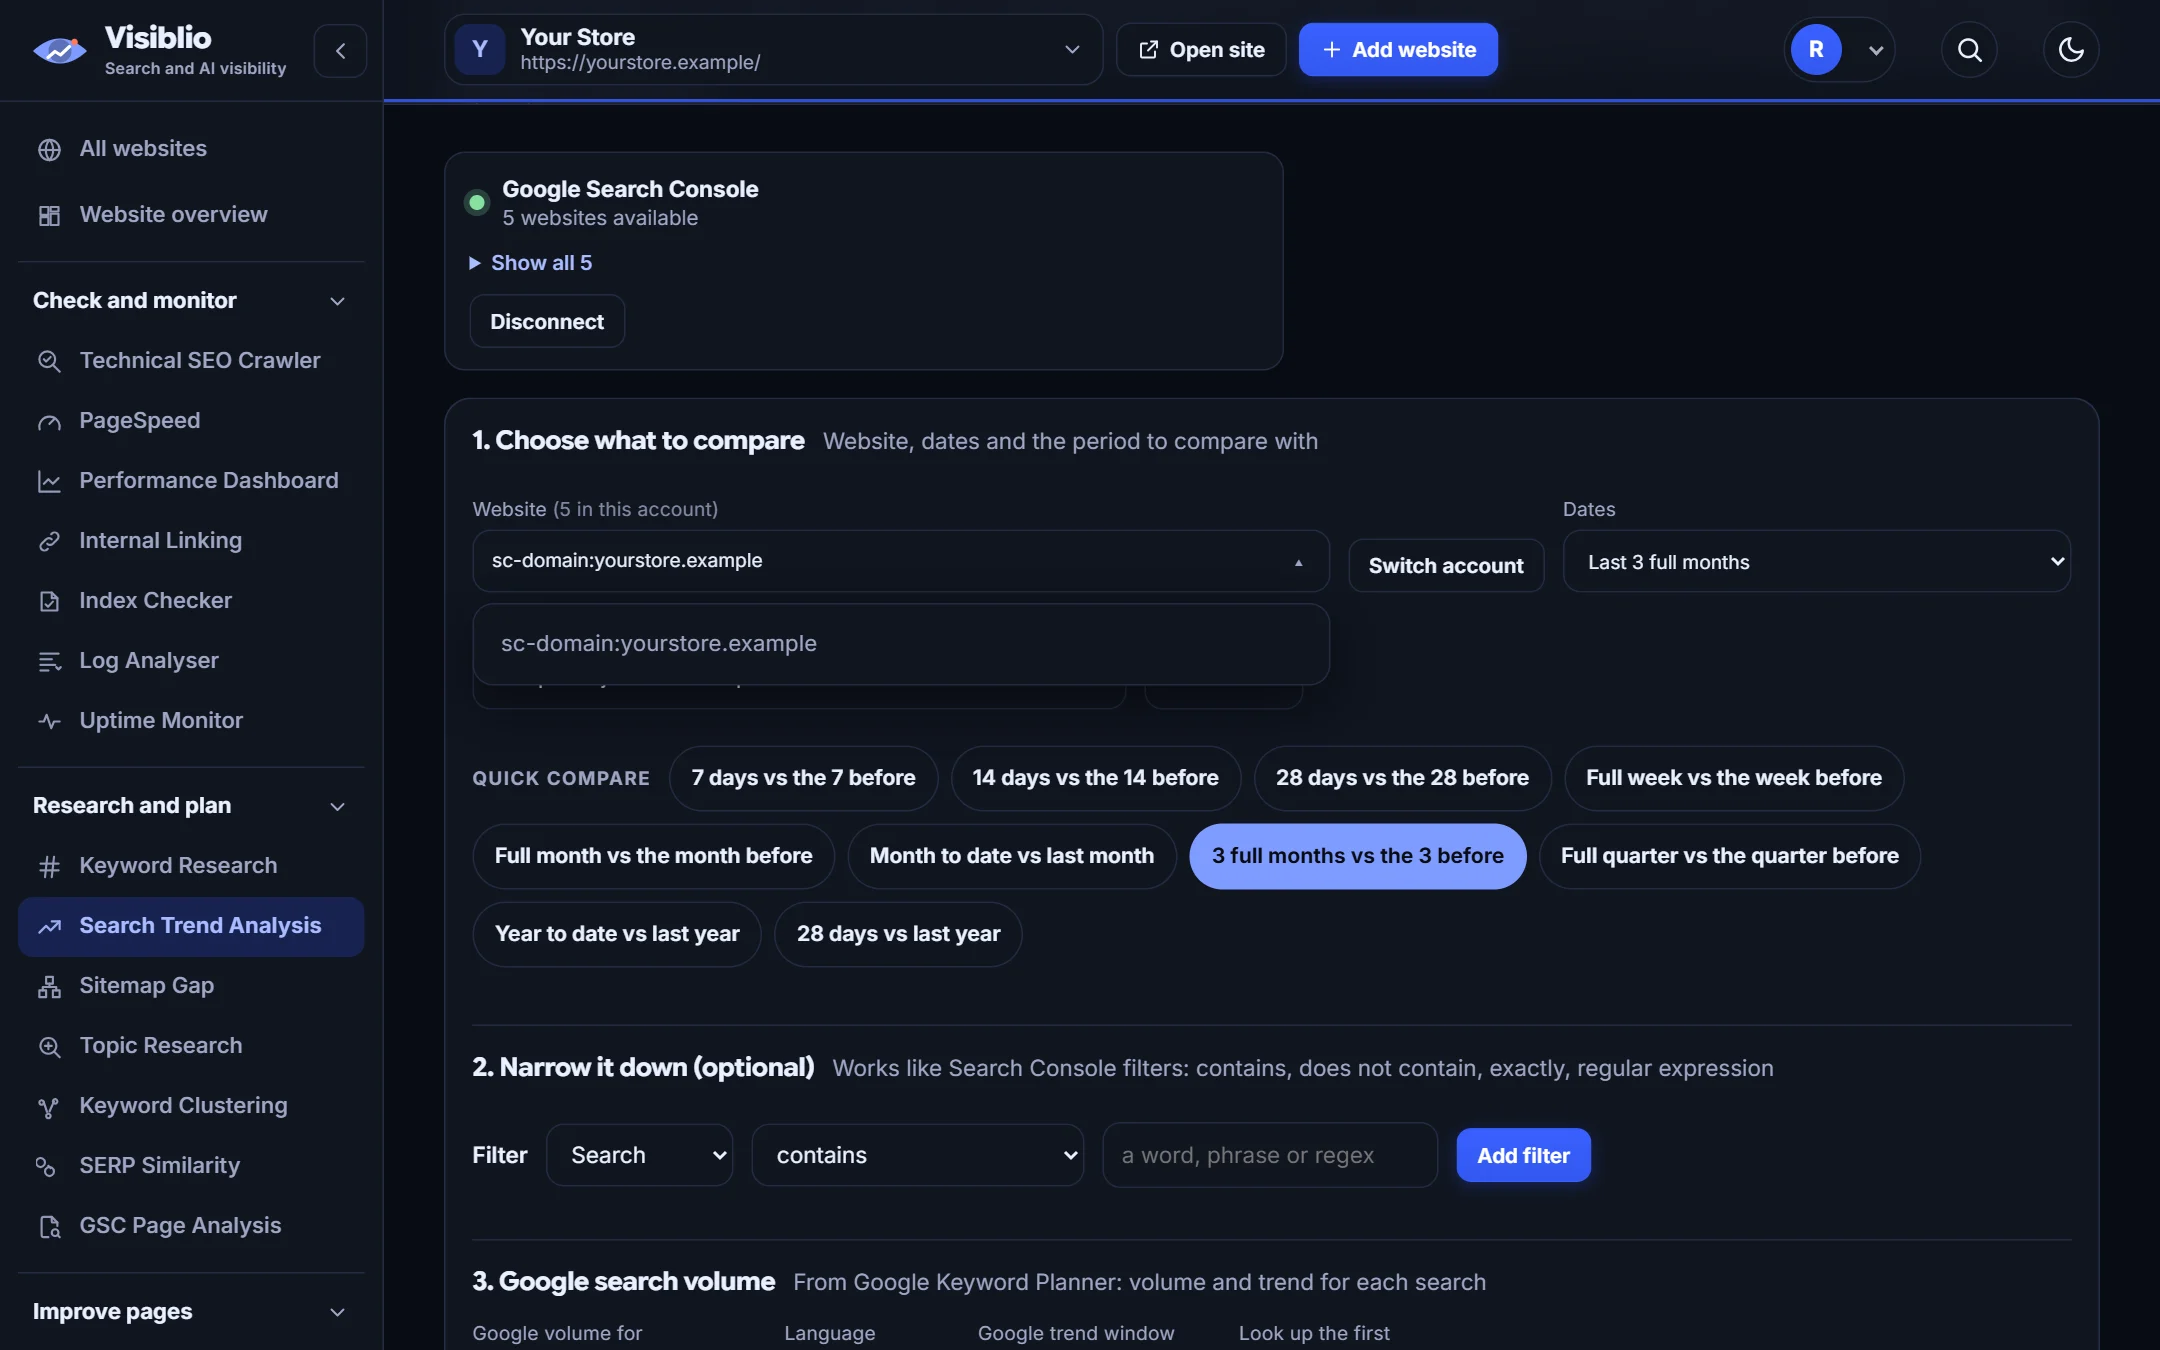
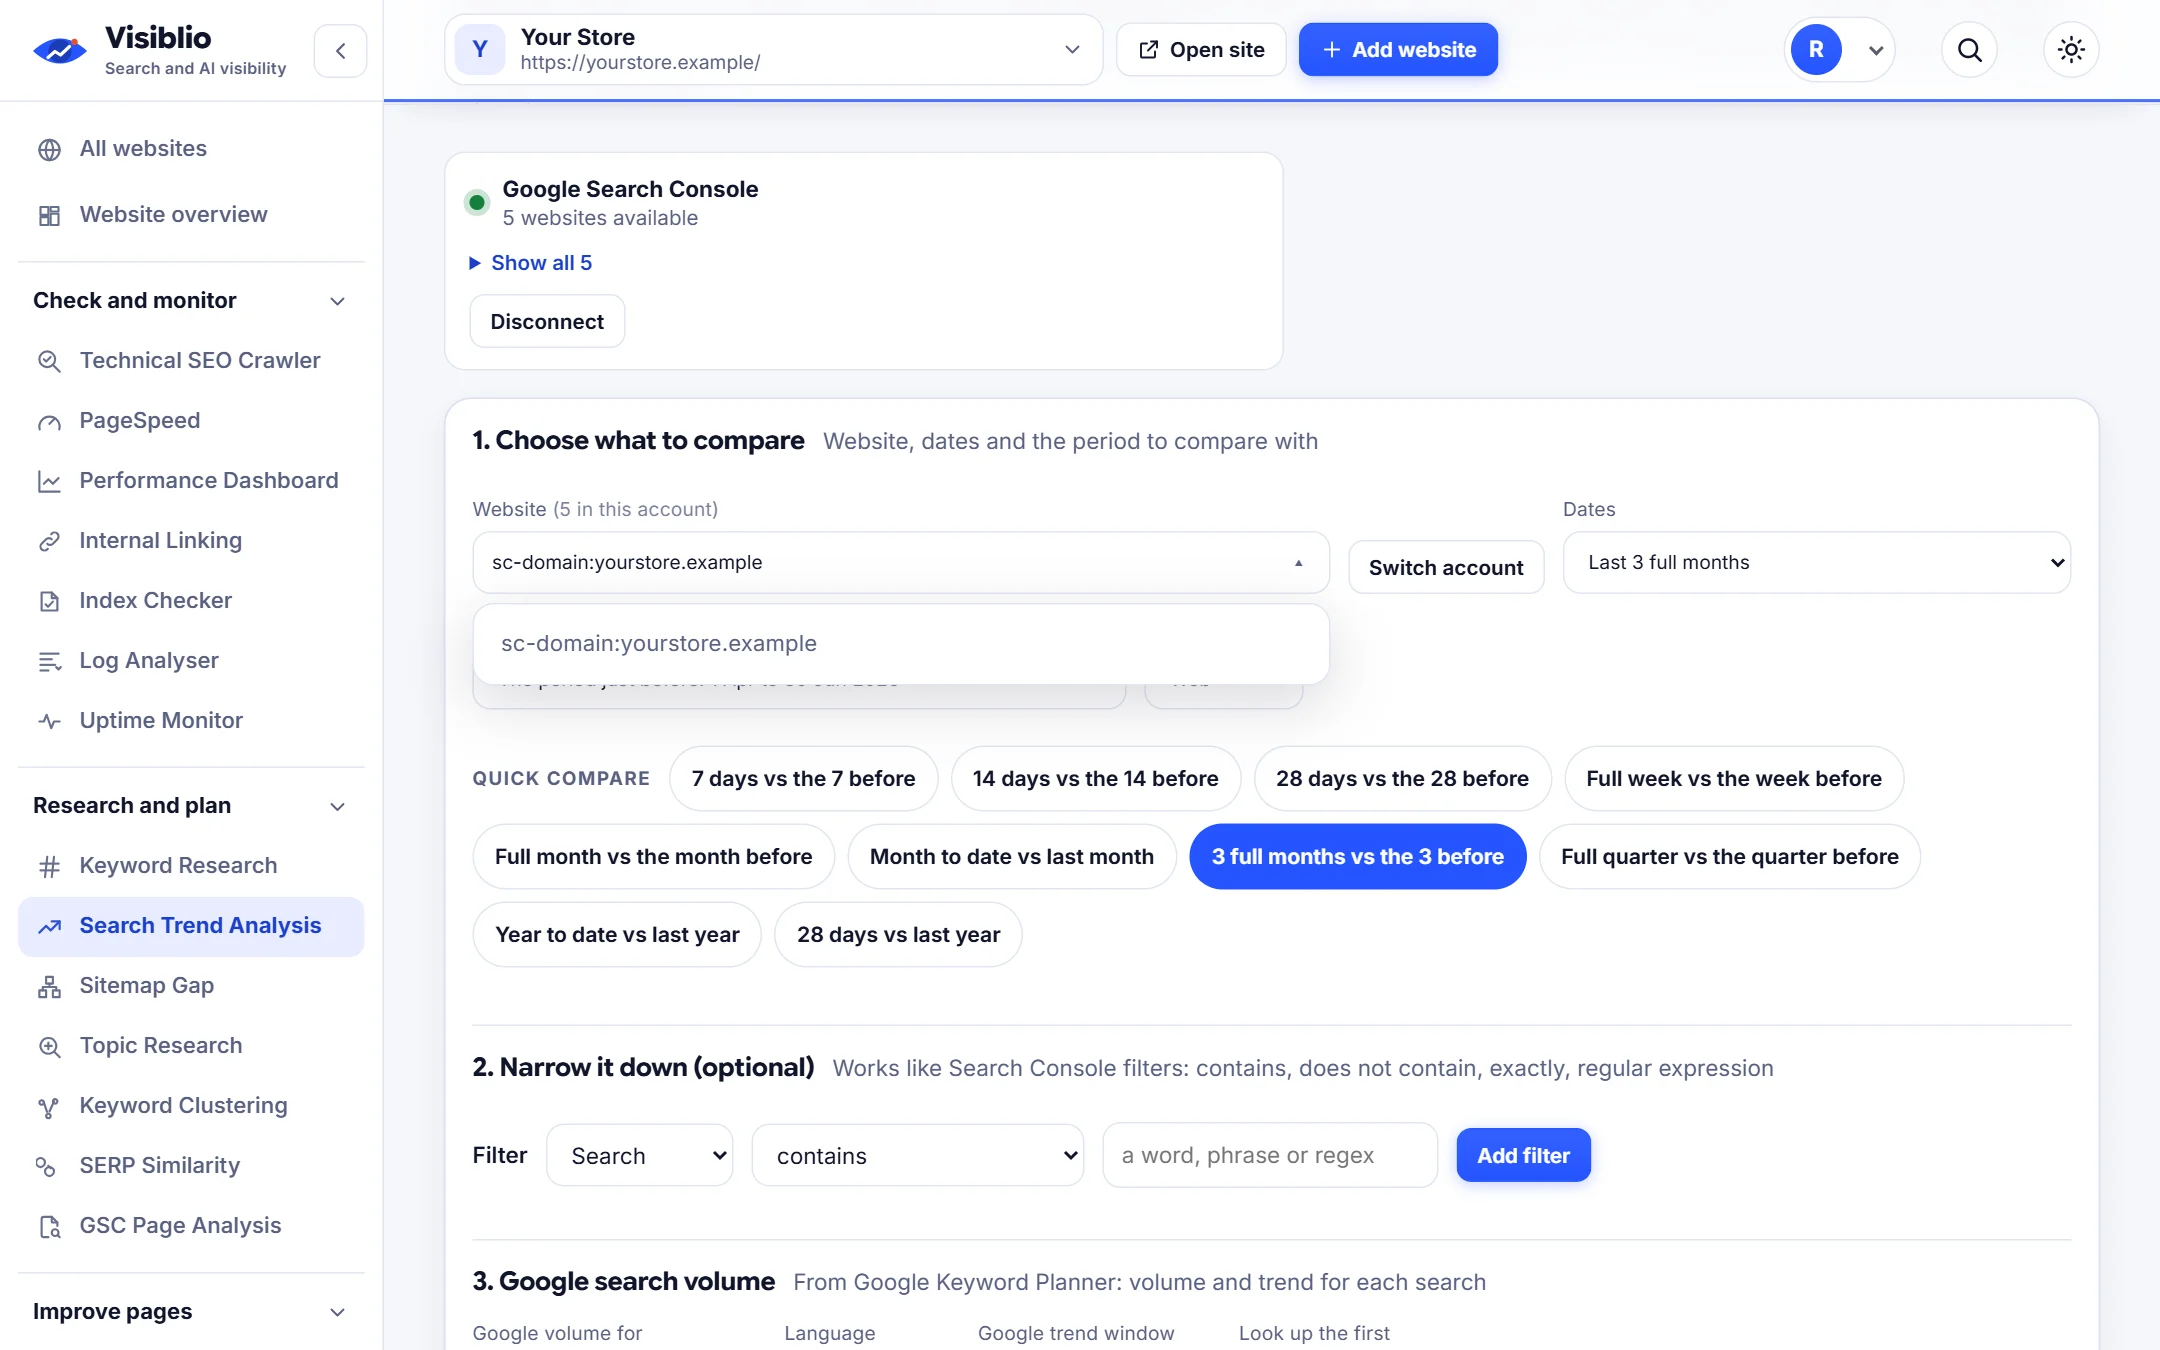
- Quick compare periods
- Brand and non-brand filter
- Biggest losers and winners

Put two periods of Search Console data next to Google's search-volume trend for each query and see at once whether clicks fell because demand fell or because you lost ground.

When clicks drop, the first question is whether people stopped searching or whether your rankings slipped. Search Trend Analysis answers it by combining your Search Console numbers for two periods with Keyword Planner volume trends for the same searches.
The result is one table you can sort and filter by clicks lost, position lost, seasonal change and more, replacing a manual spreadsheet of exports and lookups.
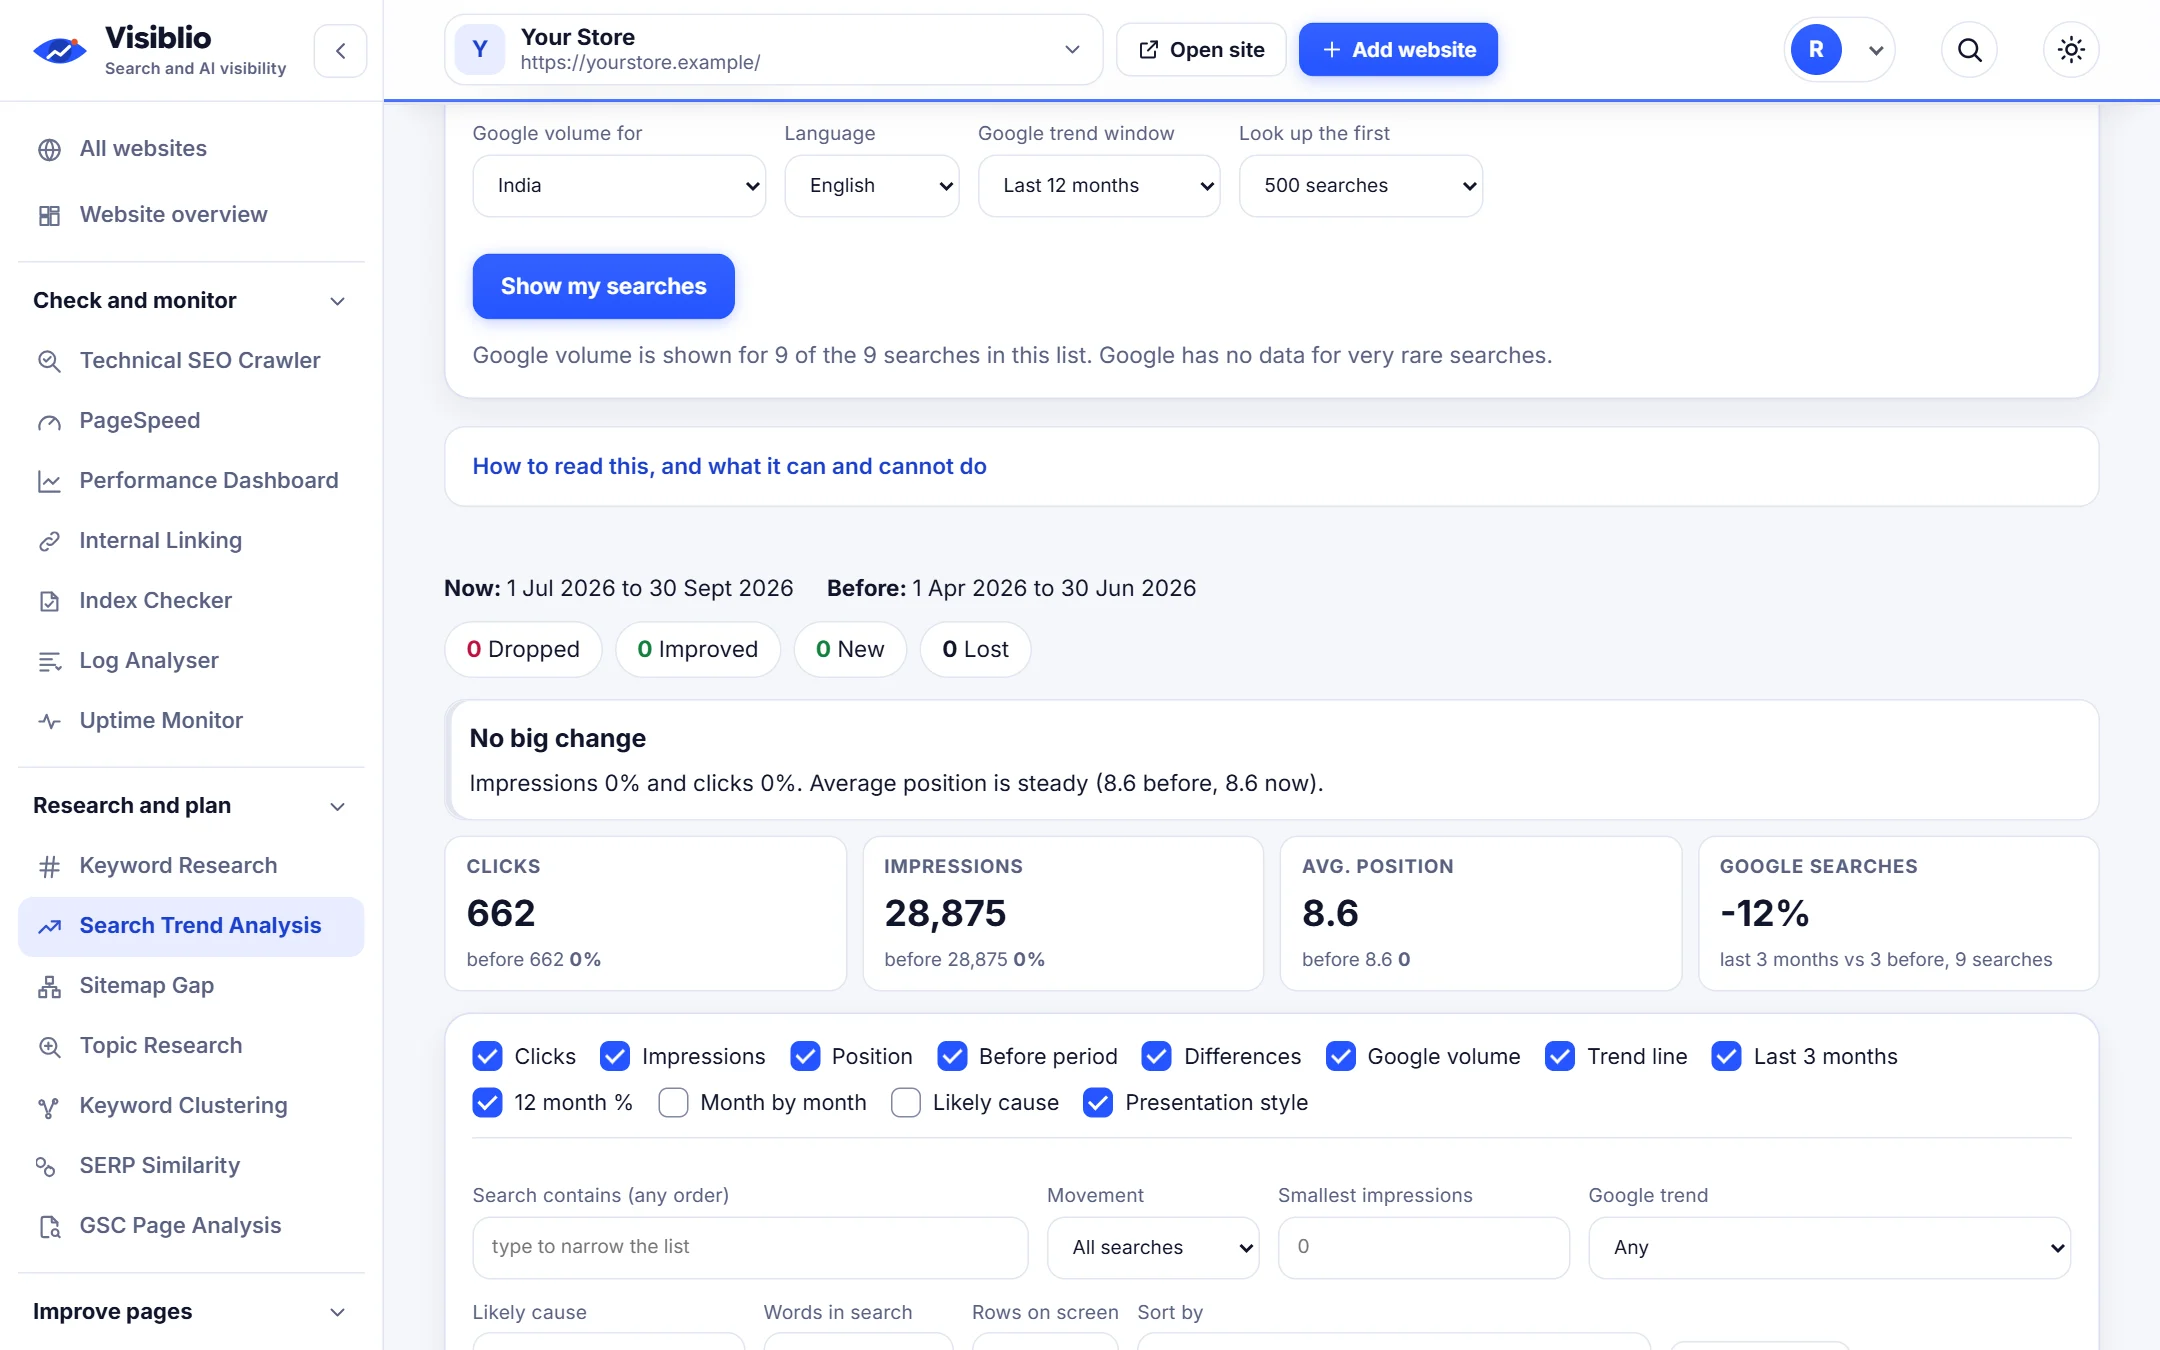
Clicks, impressions, CTR and position now and before, with the change calculated.
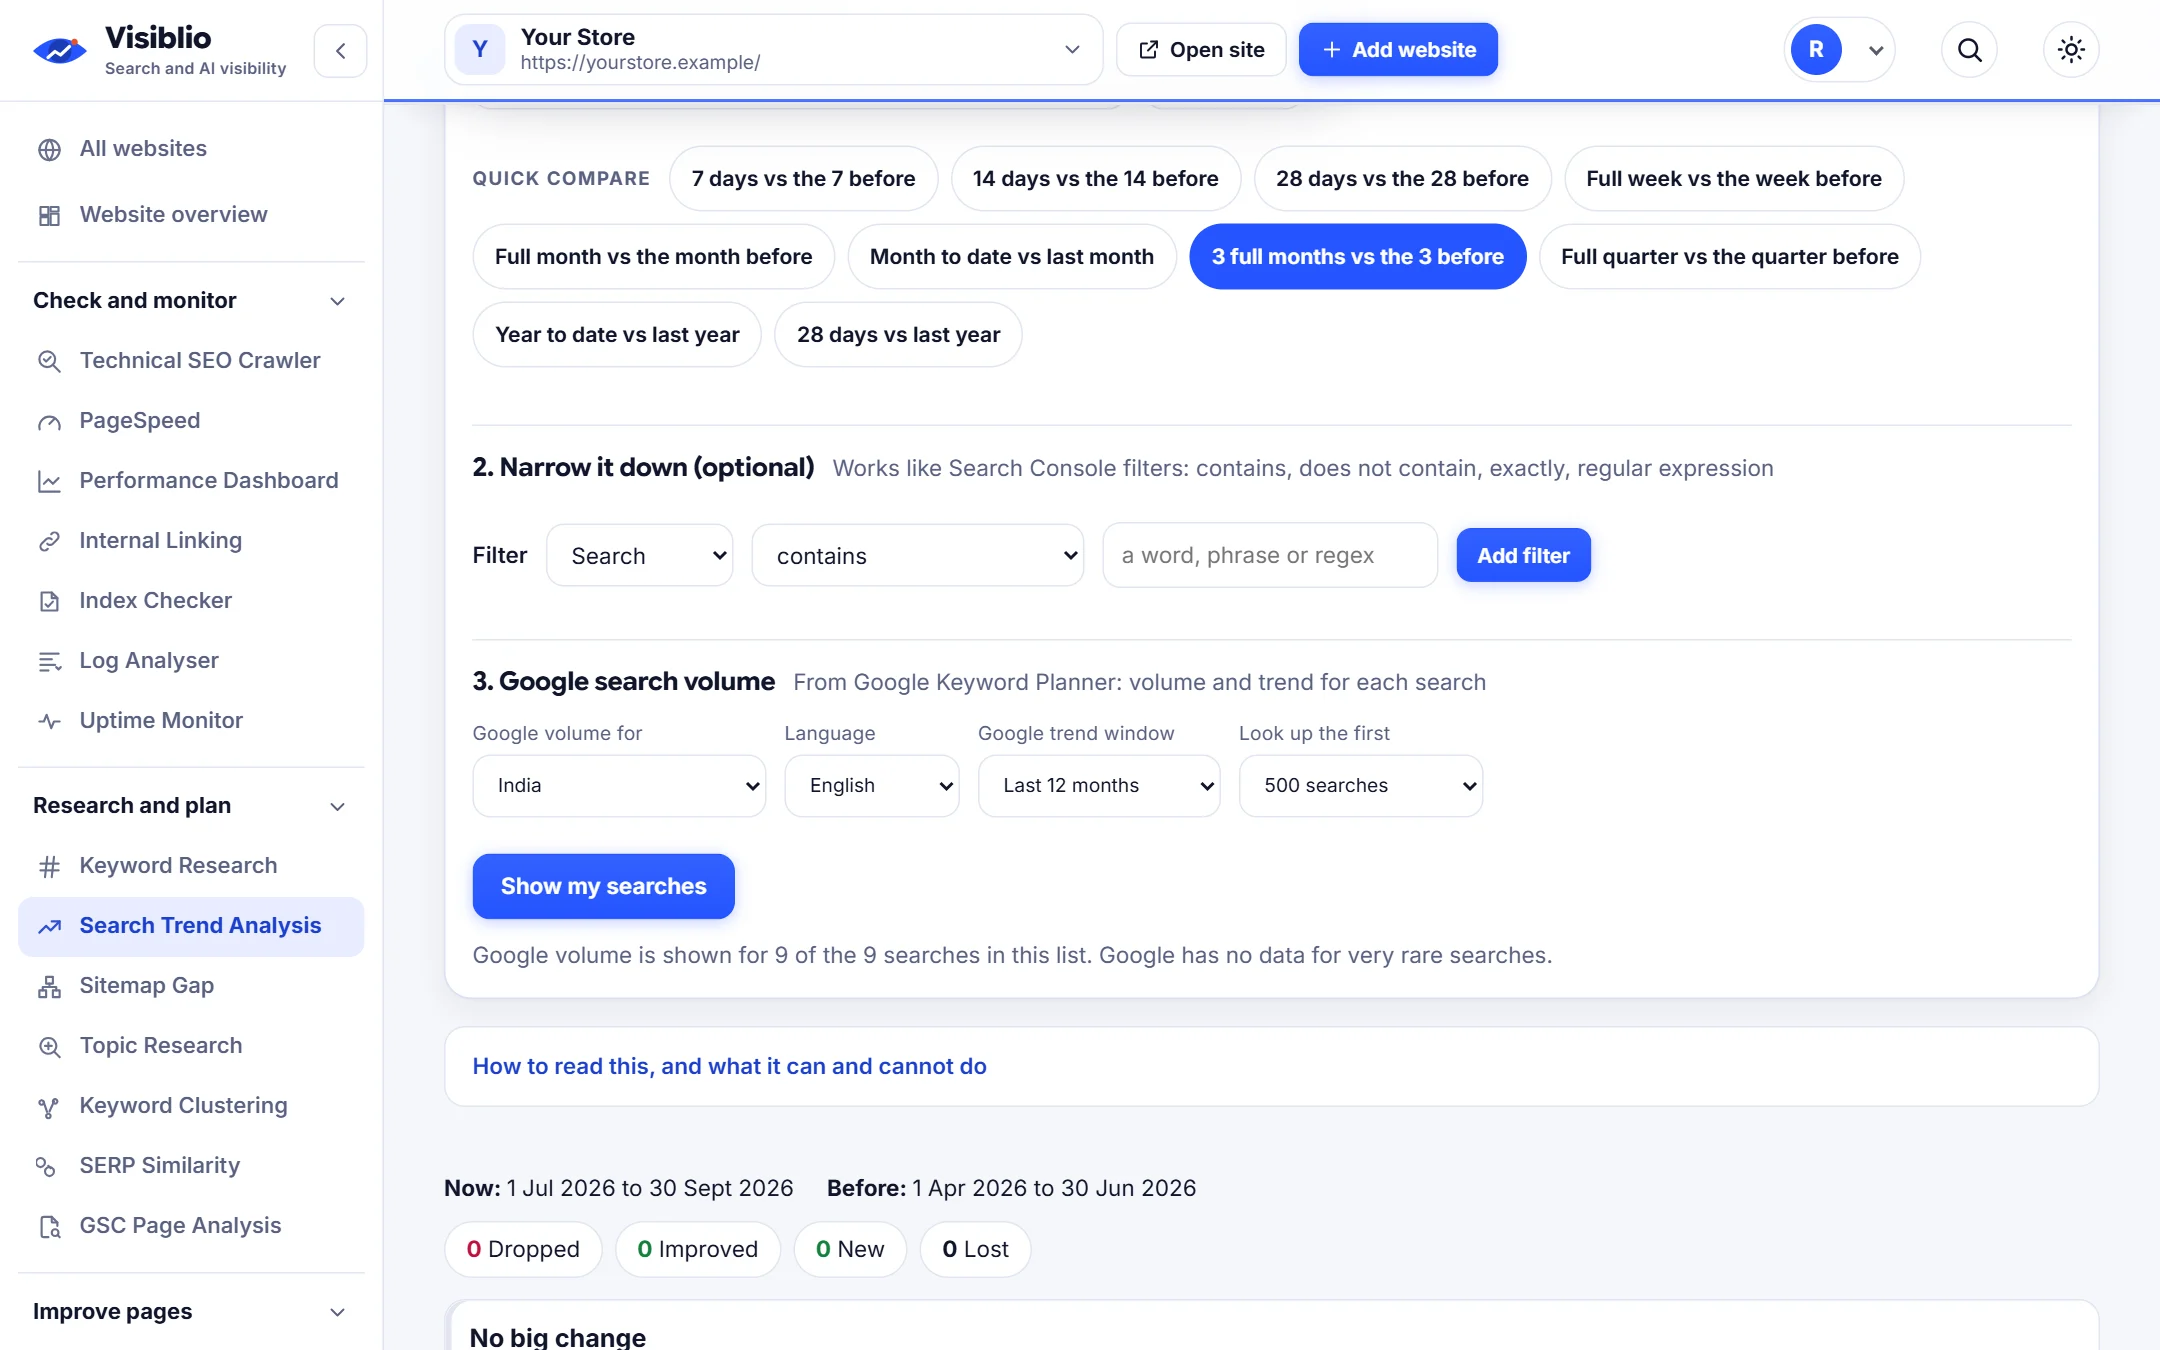
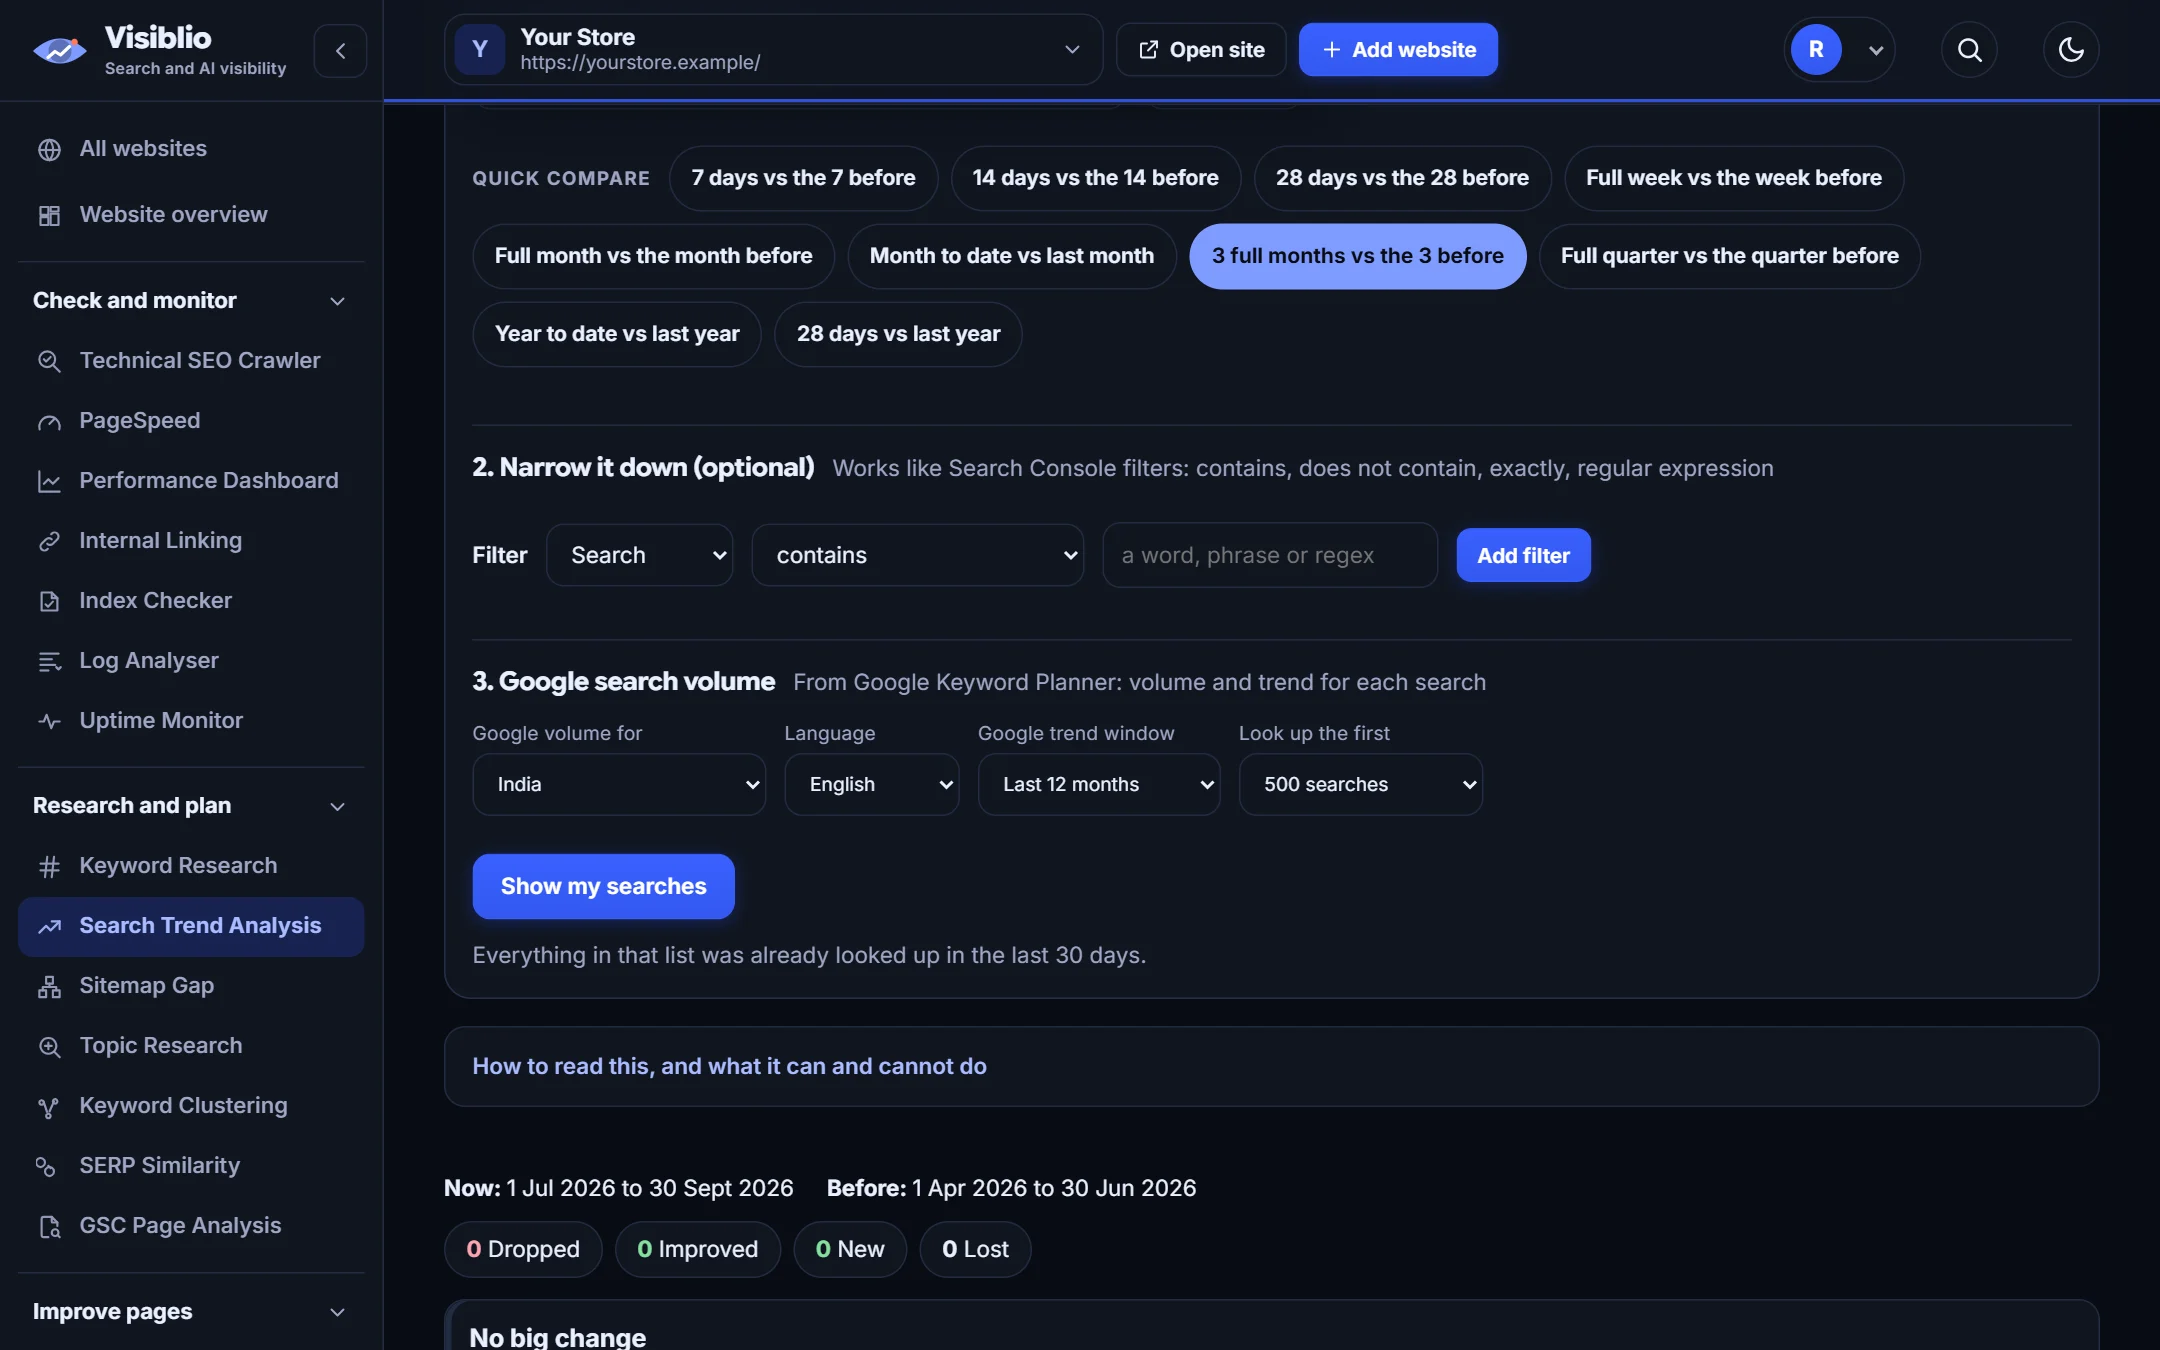
Google search-volume trend next to each query.
Quick filters separate falling demand from lost rankings.
Position difference shown so a drop in ranking is obvious.
Copy the table or export it for reports.
A sortable table of queries with the change in each metric between two periods.

Search volumes for the busiest queries show whether interest in the topic rose or fell over the same time.

Queries with falling clicks and stable demand are the ones to fix first.

Pick the dates to compare, for example this month against last month.
Visiblio reads your Search Console queries for both periods.
Filter for queries where demand held steady but clicks fell.
Explain a traffic drop to a client with evidence.
Separate seasonality from ranking problems after every algorithm update.
Decide which declining pages to refresh first.
| What you need | By hand | With Visiblio |
|---|---|---|
| Building the report | Export, merge and VLOOKUP by hand | Built into one table |
| Seasonality | Check another tool | Trend beside every query |
| Repeating it | Rebuild each month | Choose new dates and run again |
| Sharing | Paste into slides | Export the table |
The usual causes are lower demand (seasonality or a changing market), lost rankings (competitors, algorithm updates, site problems) or lower click-through rates. Comparing periods and demand trends separates them.
It shows Google's search-volume trend for each query next to your own click and position change. If volume fell by a similar amount, it is likely seasonal; if volume held and your position fell, you lost ground.
Your Search Console query data for two periods, and Google Keyword Planner volume trends for the busiest queries.
It loads up to tens of thousands of queries per period and looks up volumes for the busiest ones, so the table stays fast.
You can start for free. Plans set how many keyword lookups the volume trends can use.
Open the tool, add your website or a page address and see the result in minutes. It is free to start.