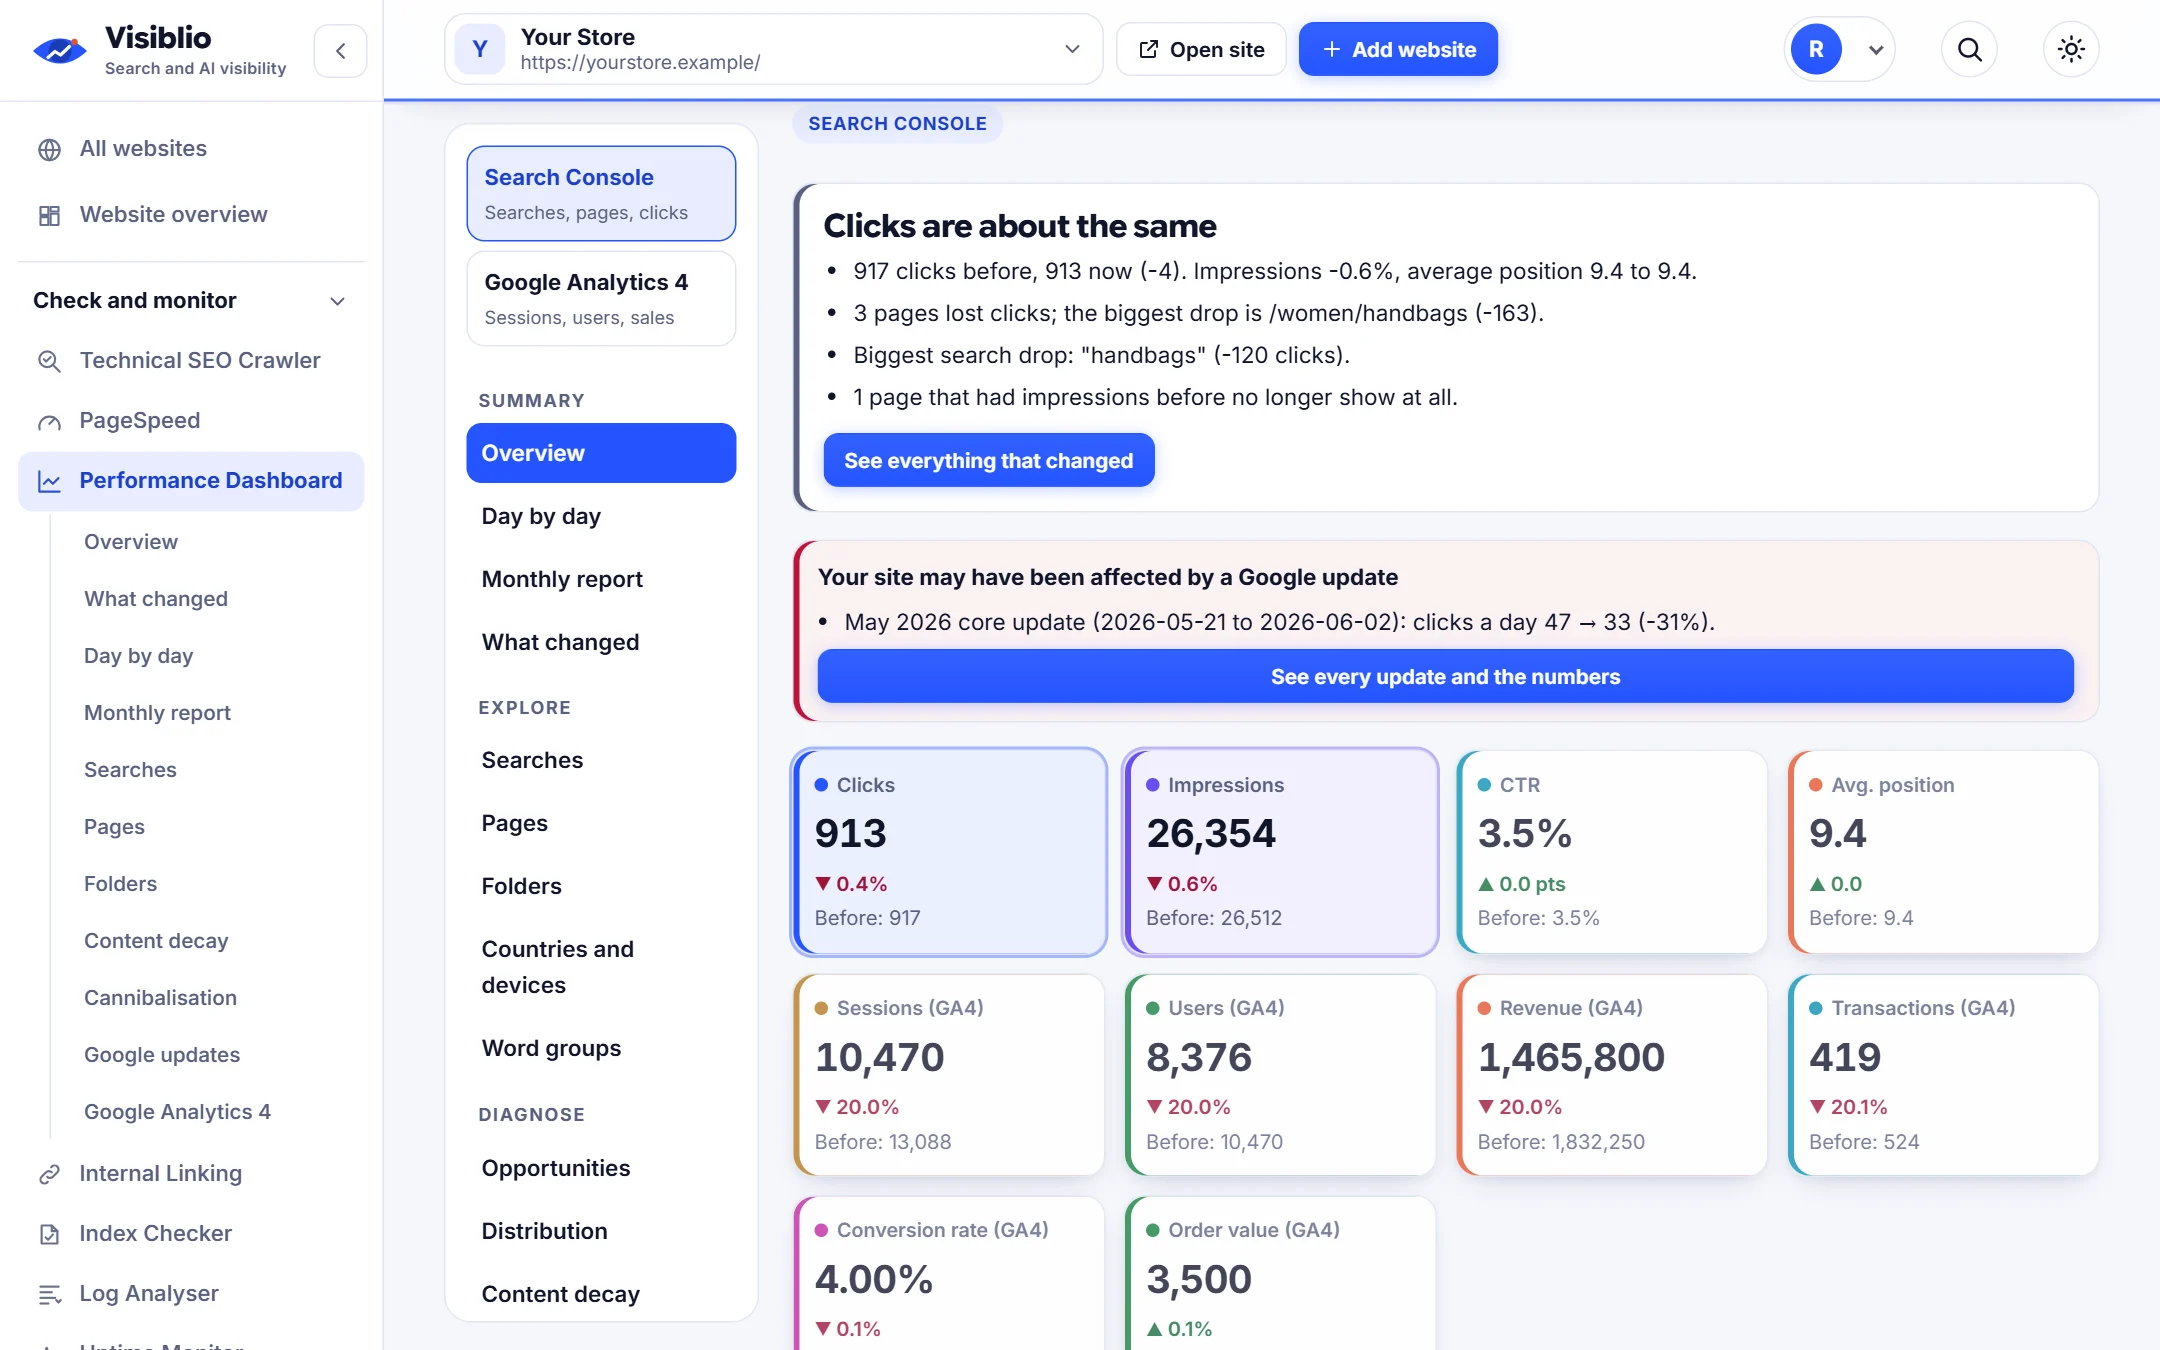
A plain summary before any chart
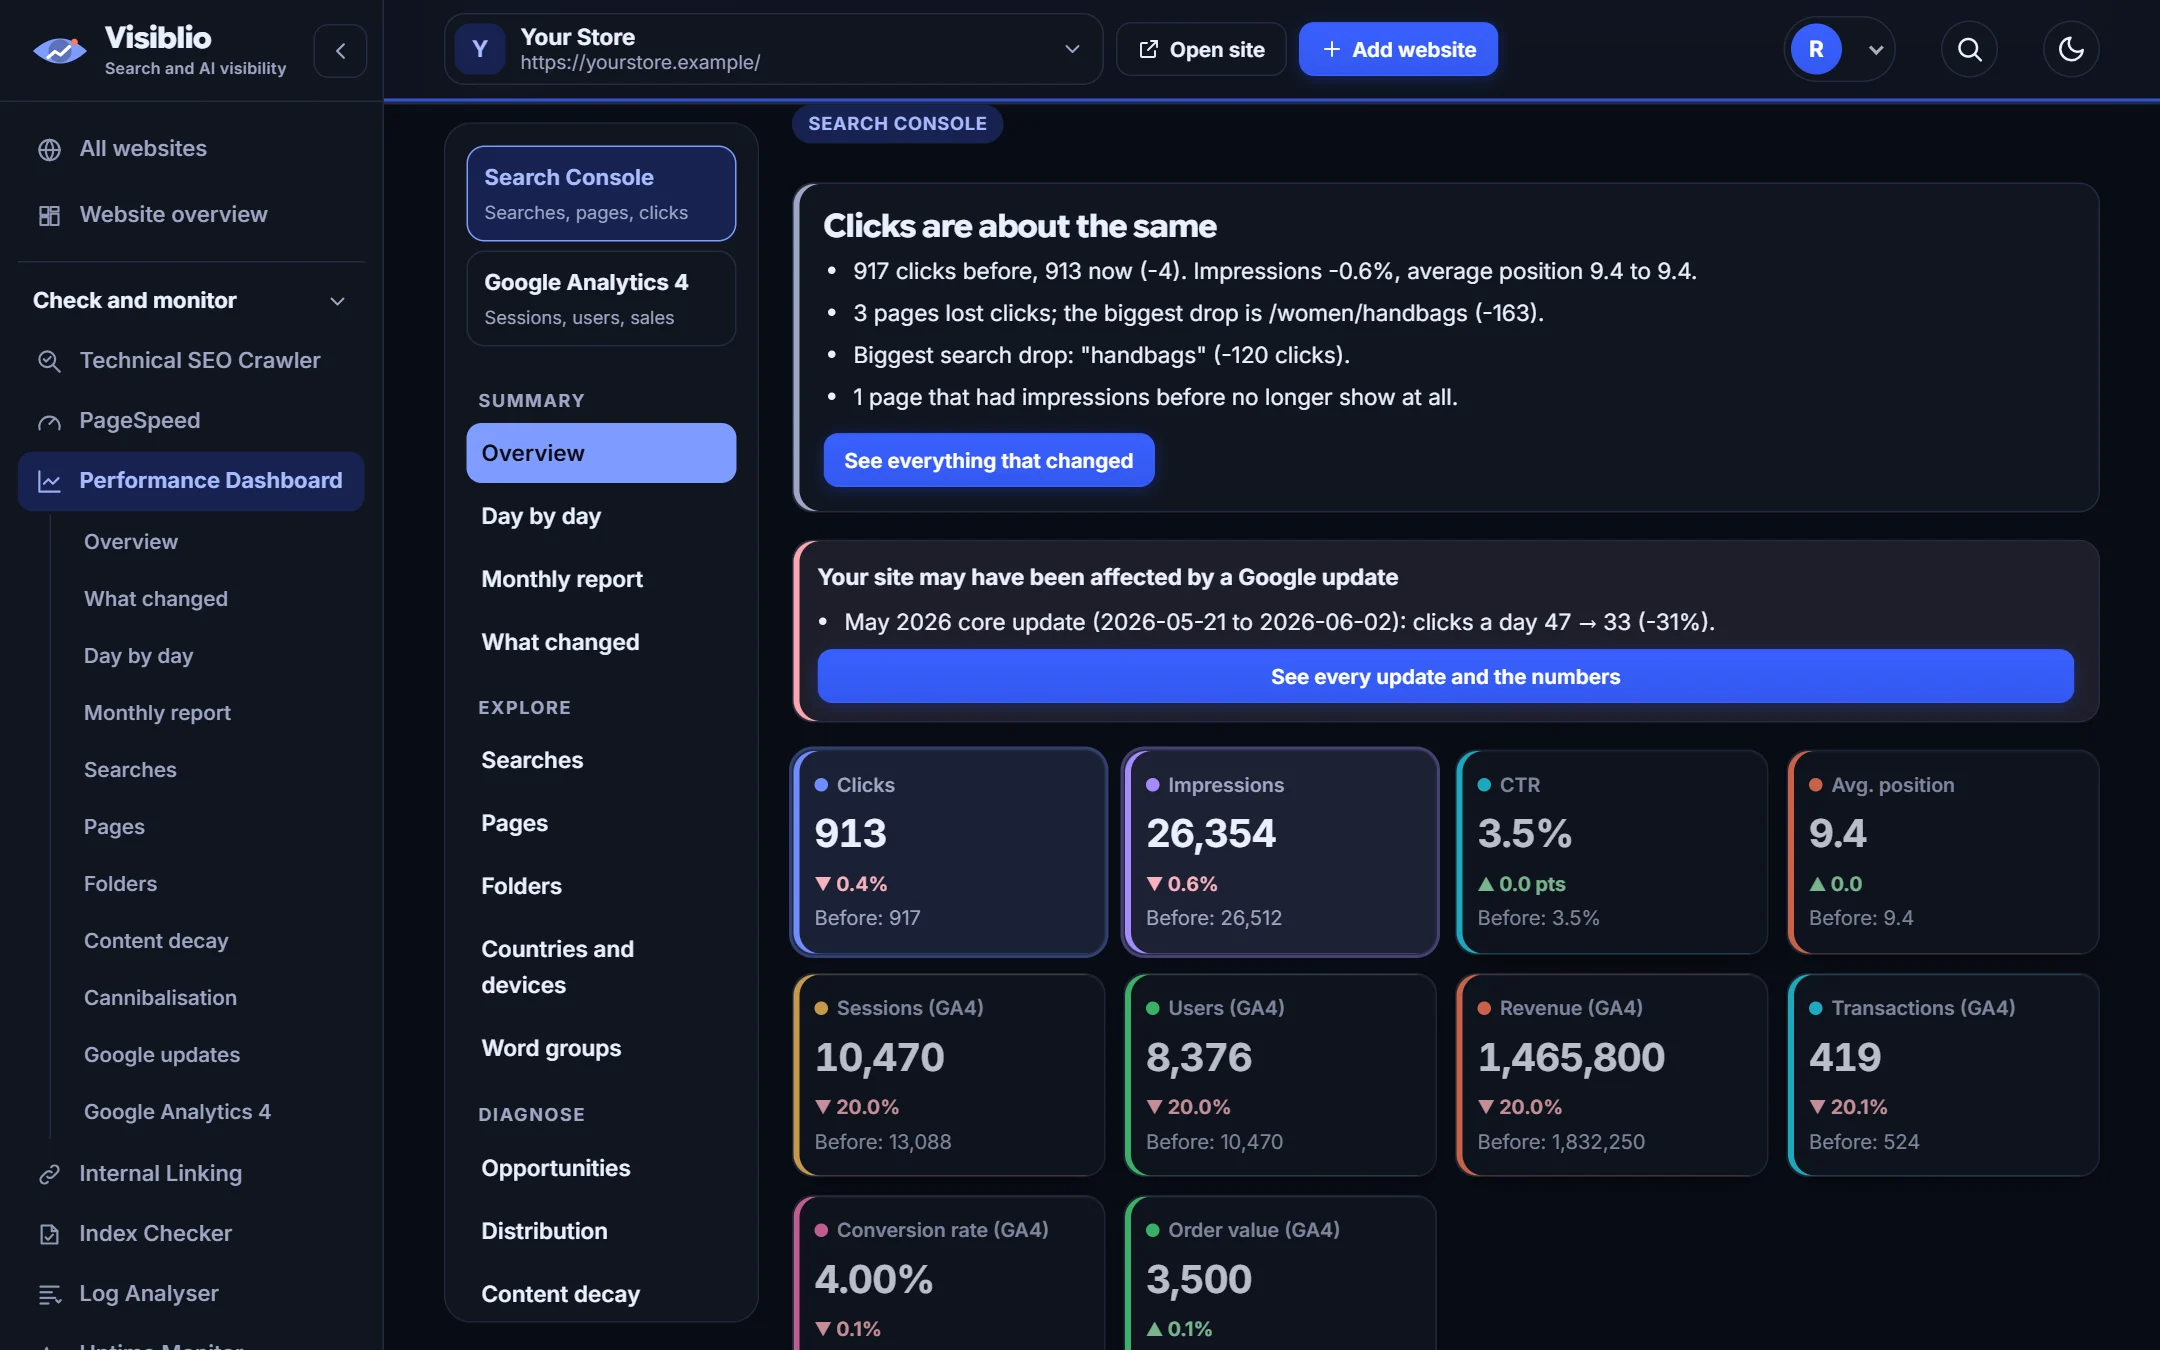
Totals and changes are written in words, then shown on charts that keep the same size so they are easy to compare.
- Daily and monthly views
- Filters for page, query, country and device
- Copy any table

Search Console and Google Analytics side by side. Pick two periods and read which pages dropped, which improved and whether a Google update was behind it.

Switching between Search Console and Analytics hides the story. The Visiblio Performance Dashboard puts clicks, impressions, CTR, position, sessions and revenue in one view, with a plain-language summary before any chart.
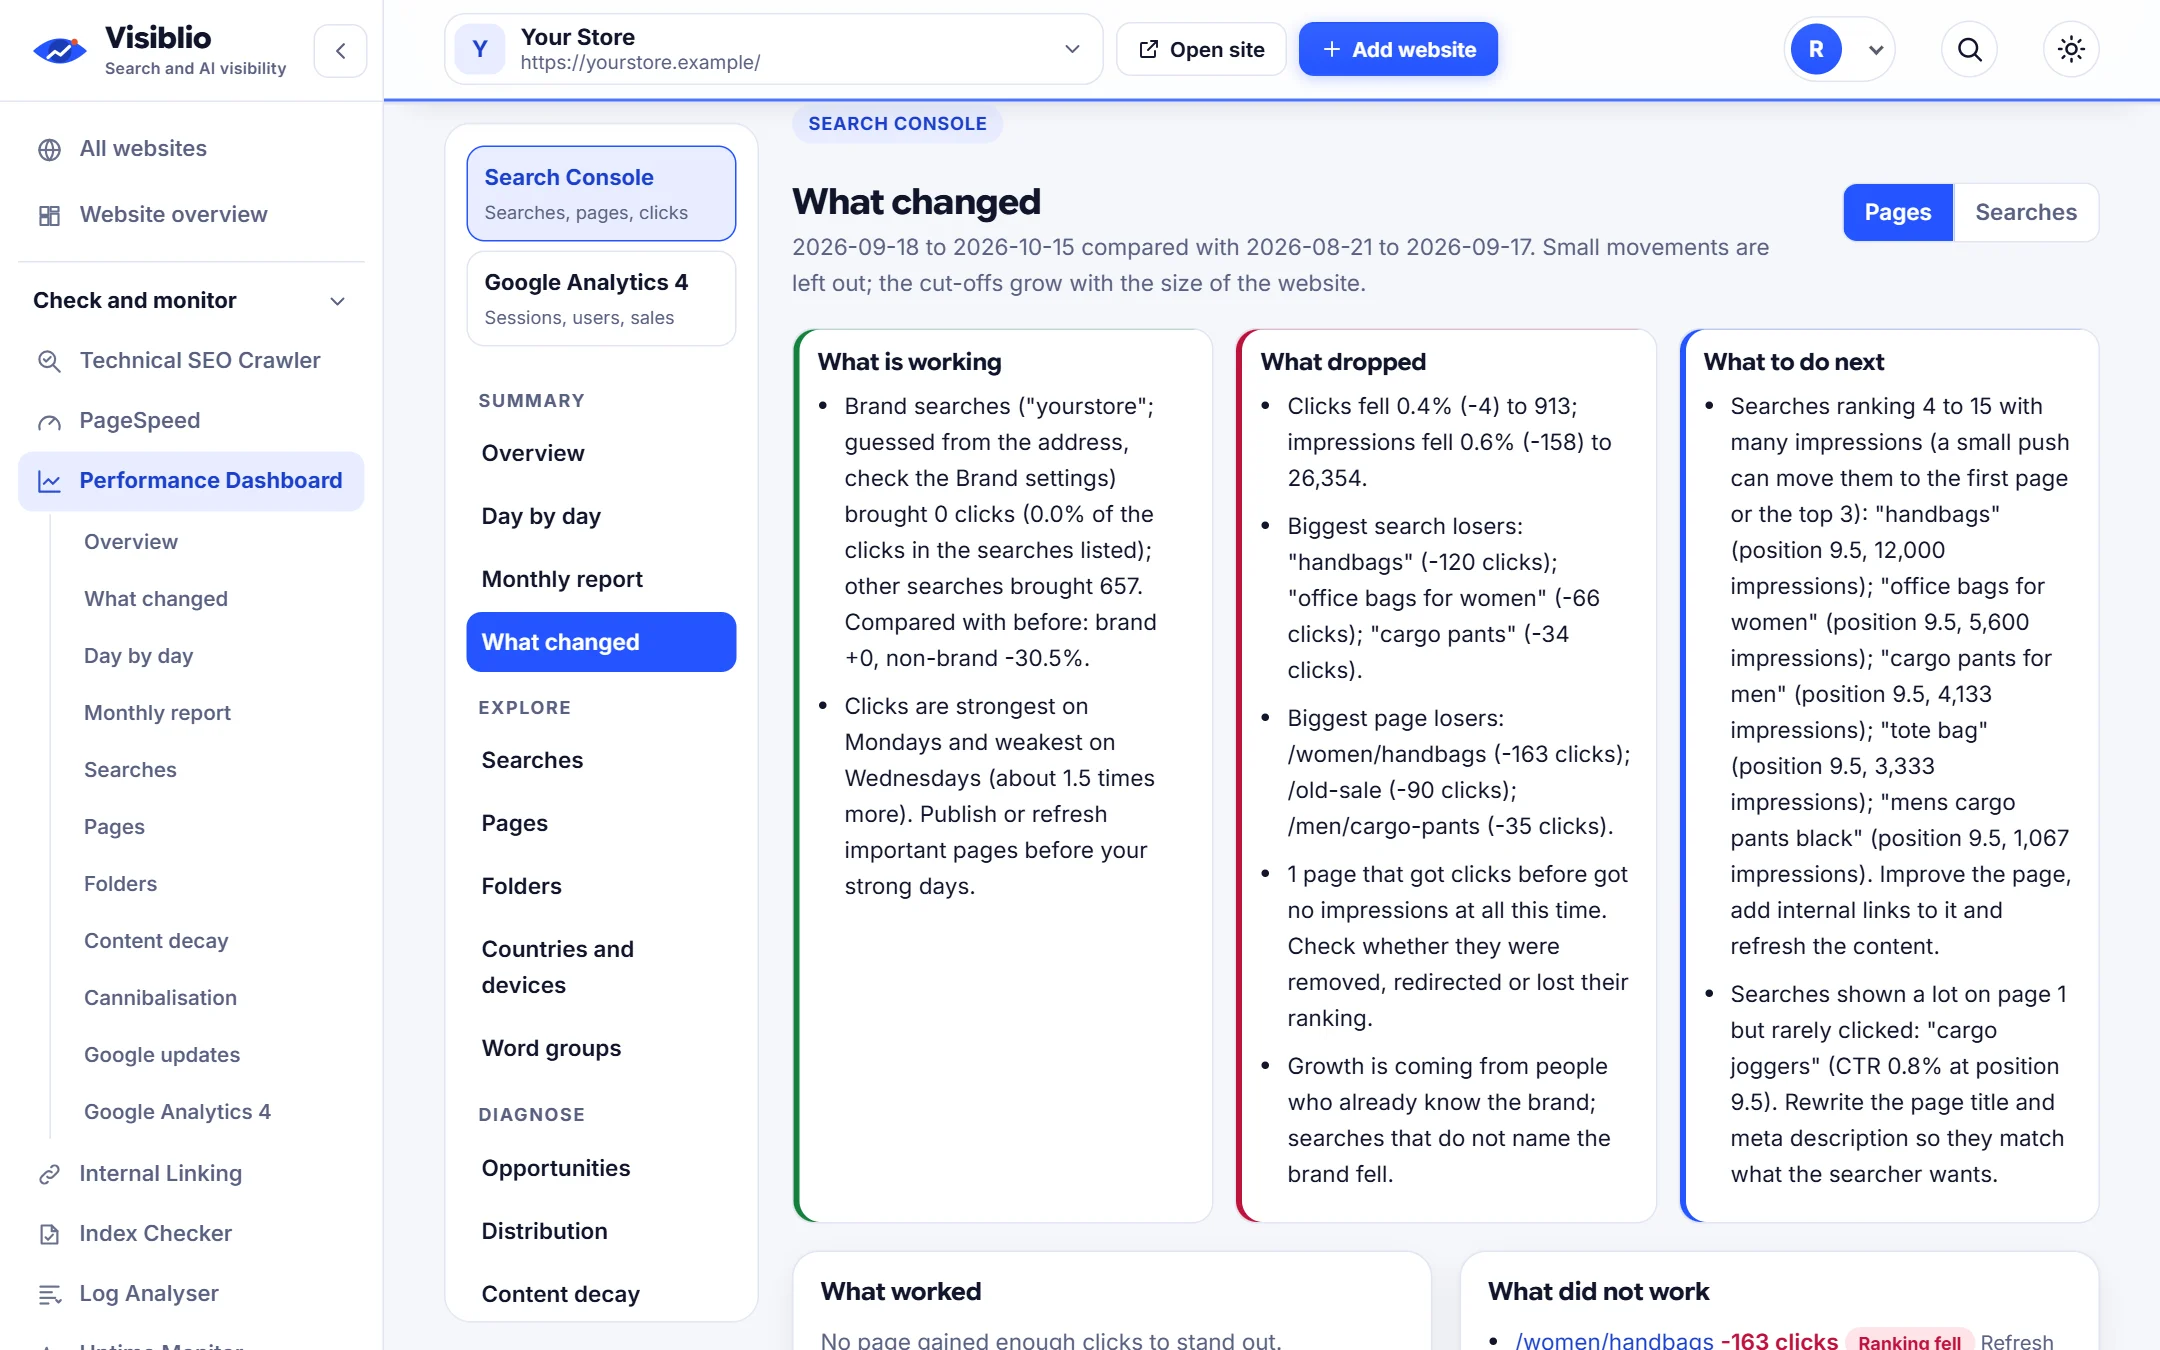
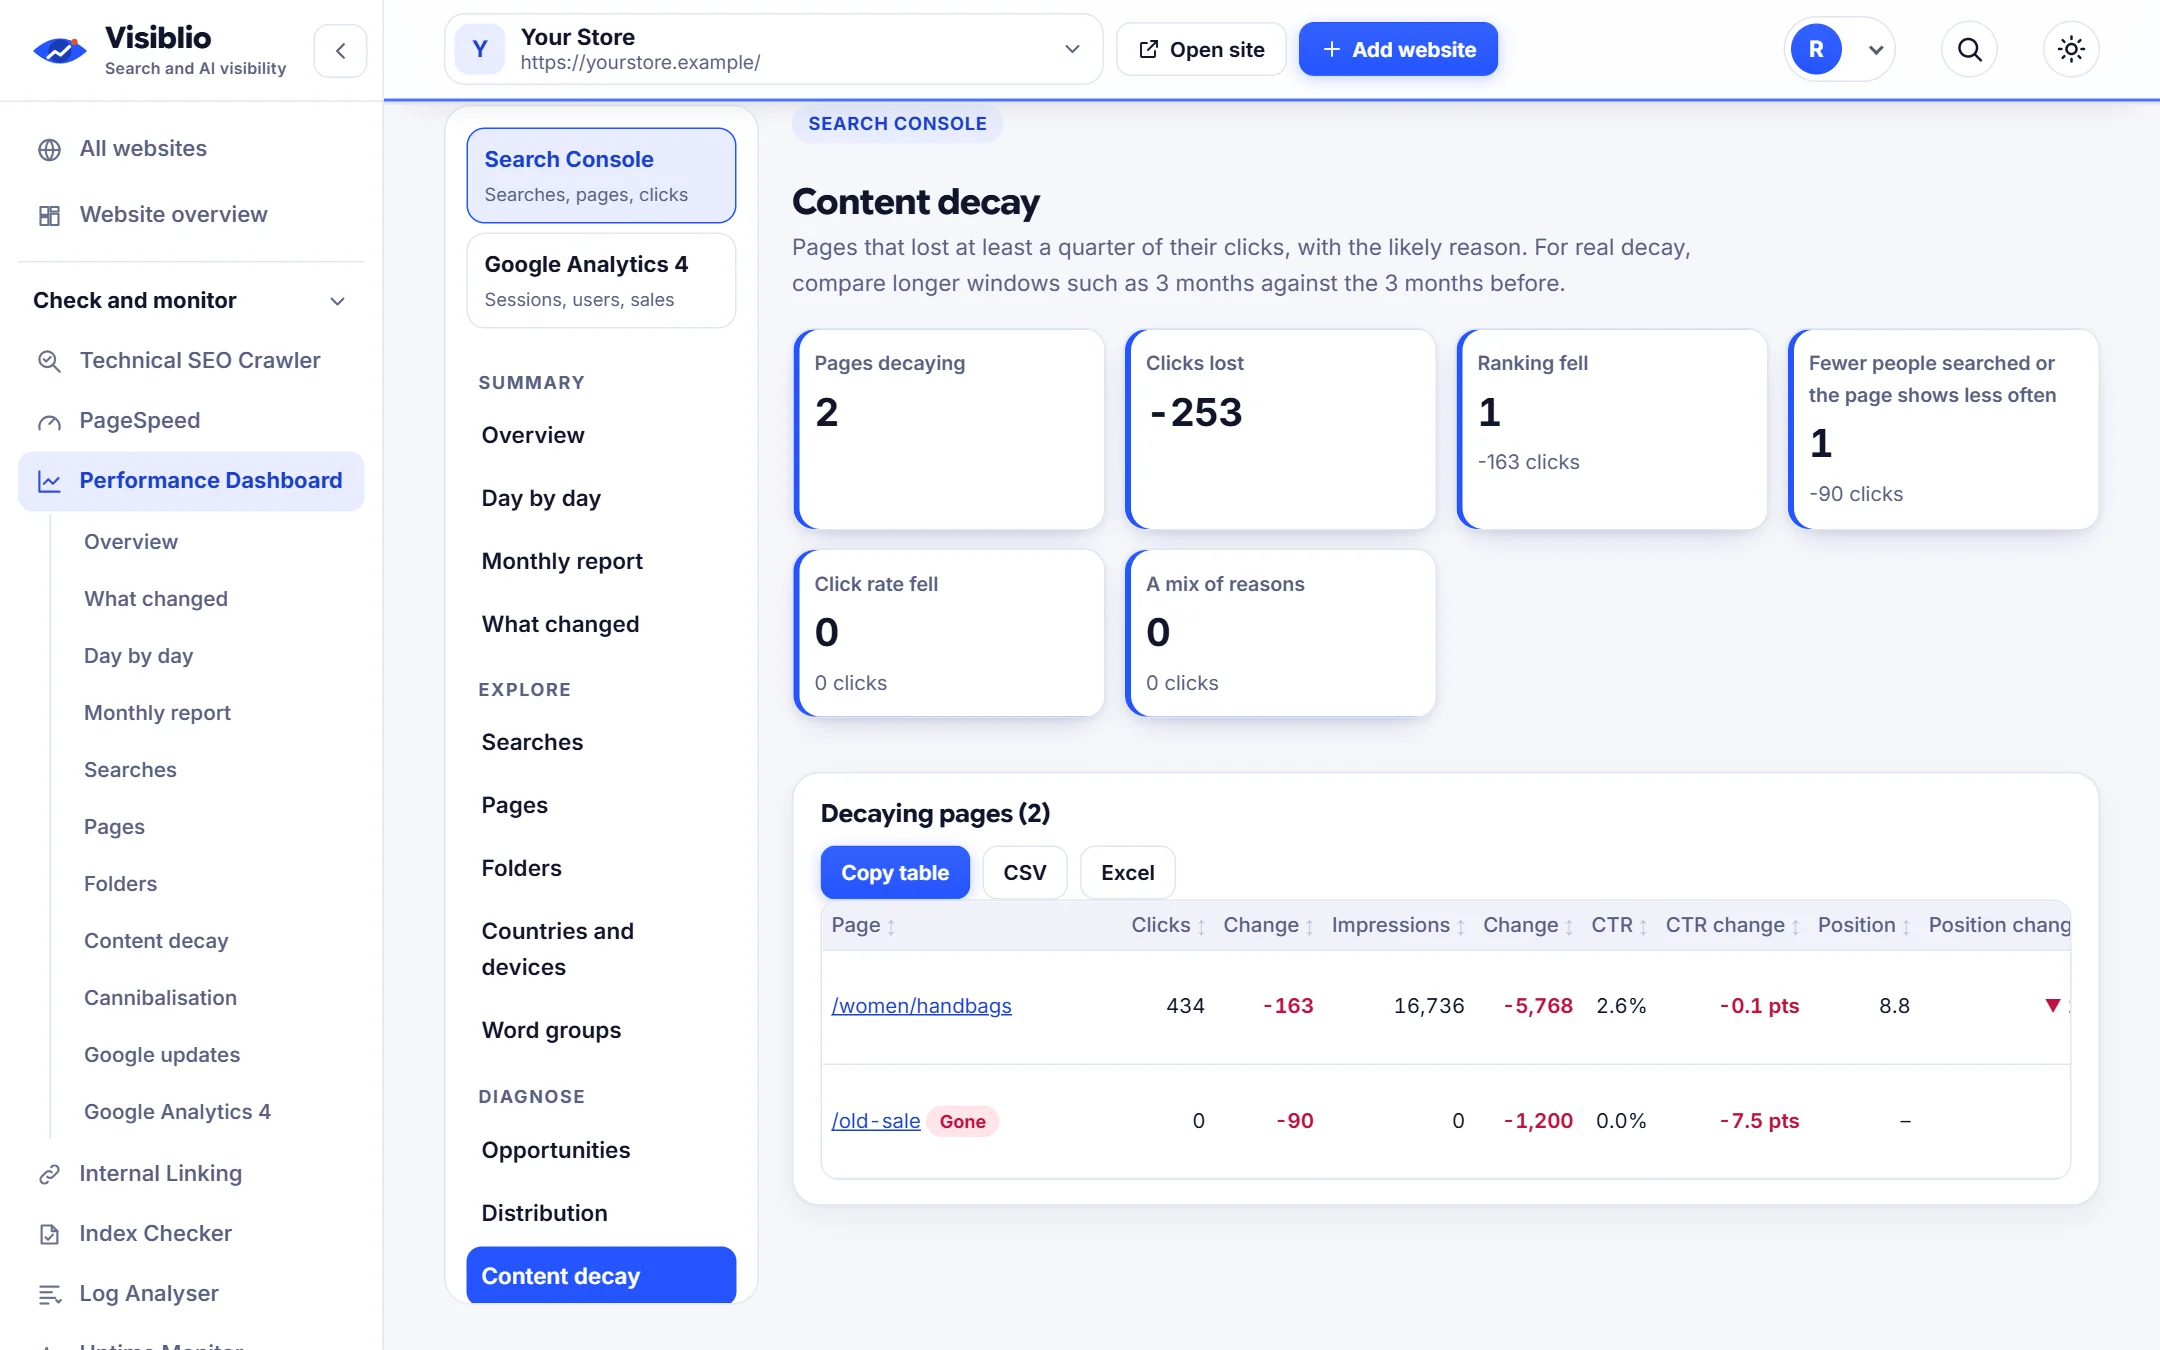
Every table can be copied into a sheet, and views for pages, searches, folders, countries, devices and content decay help you find what changed and what to do about it.
Search numbers beside sessions and revenue.
Search Console style comparisons with quick period chips.
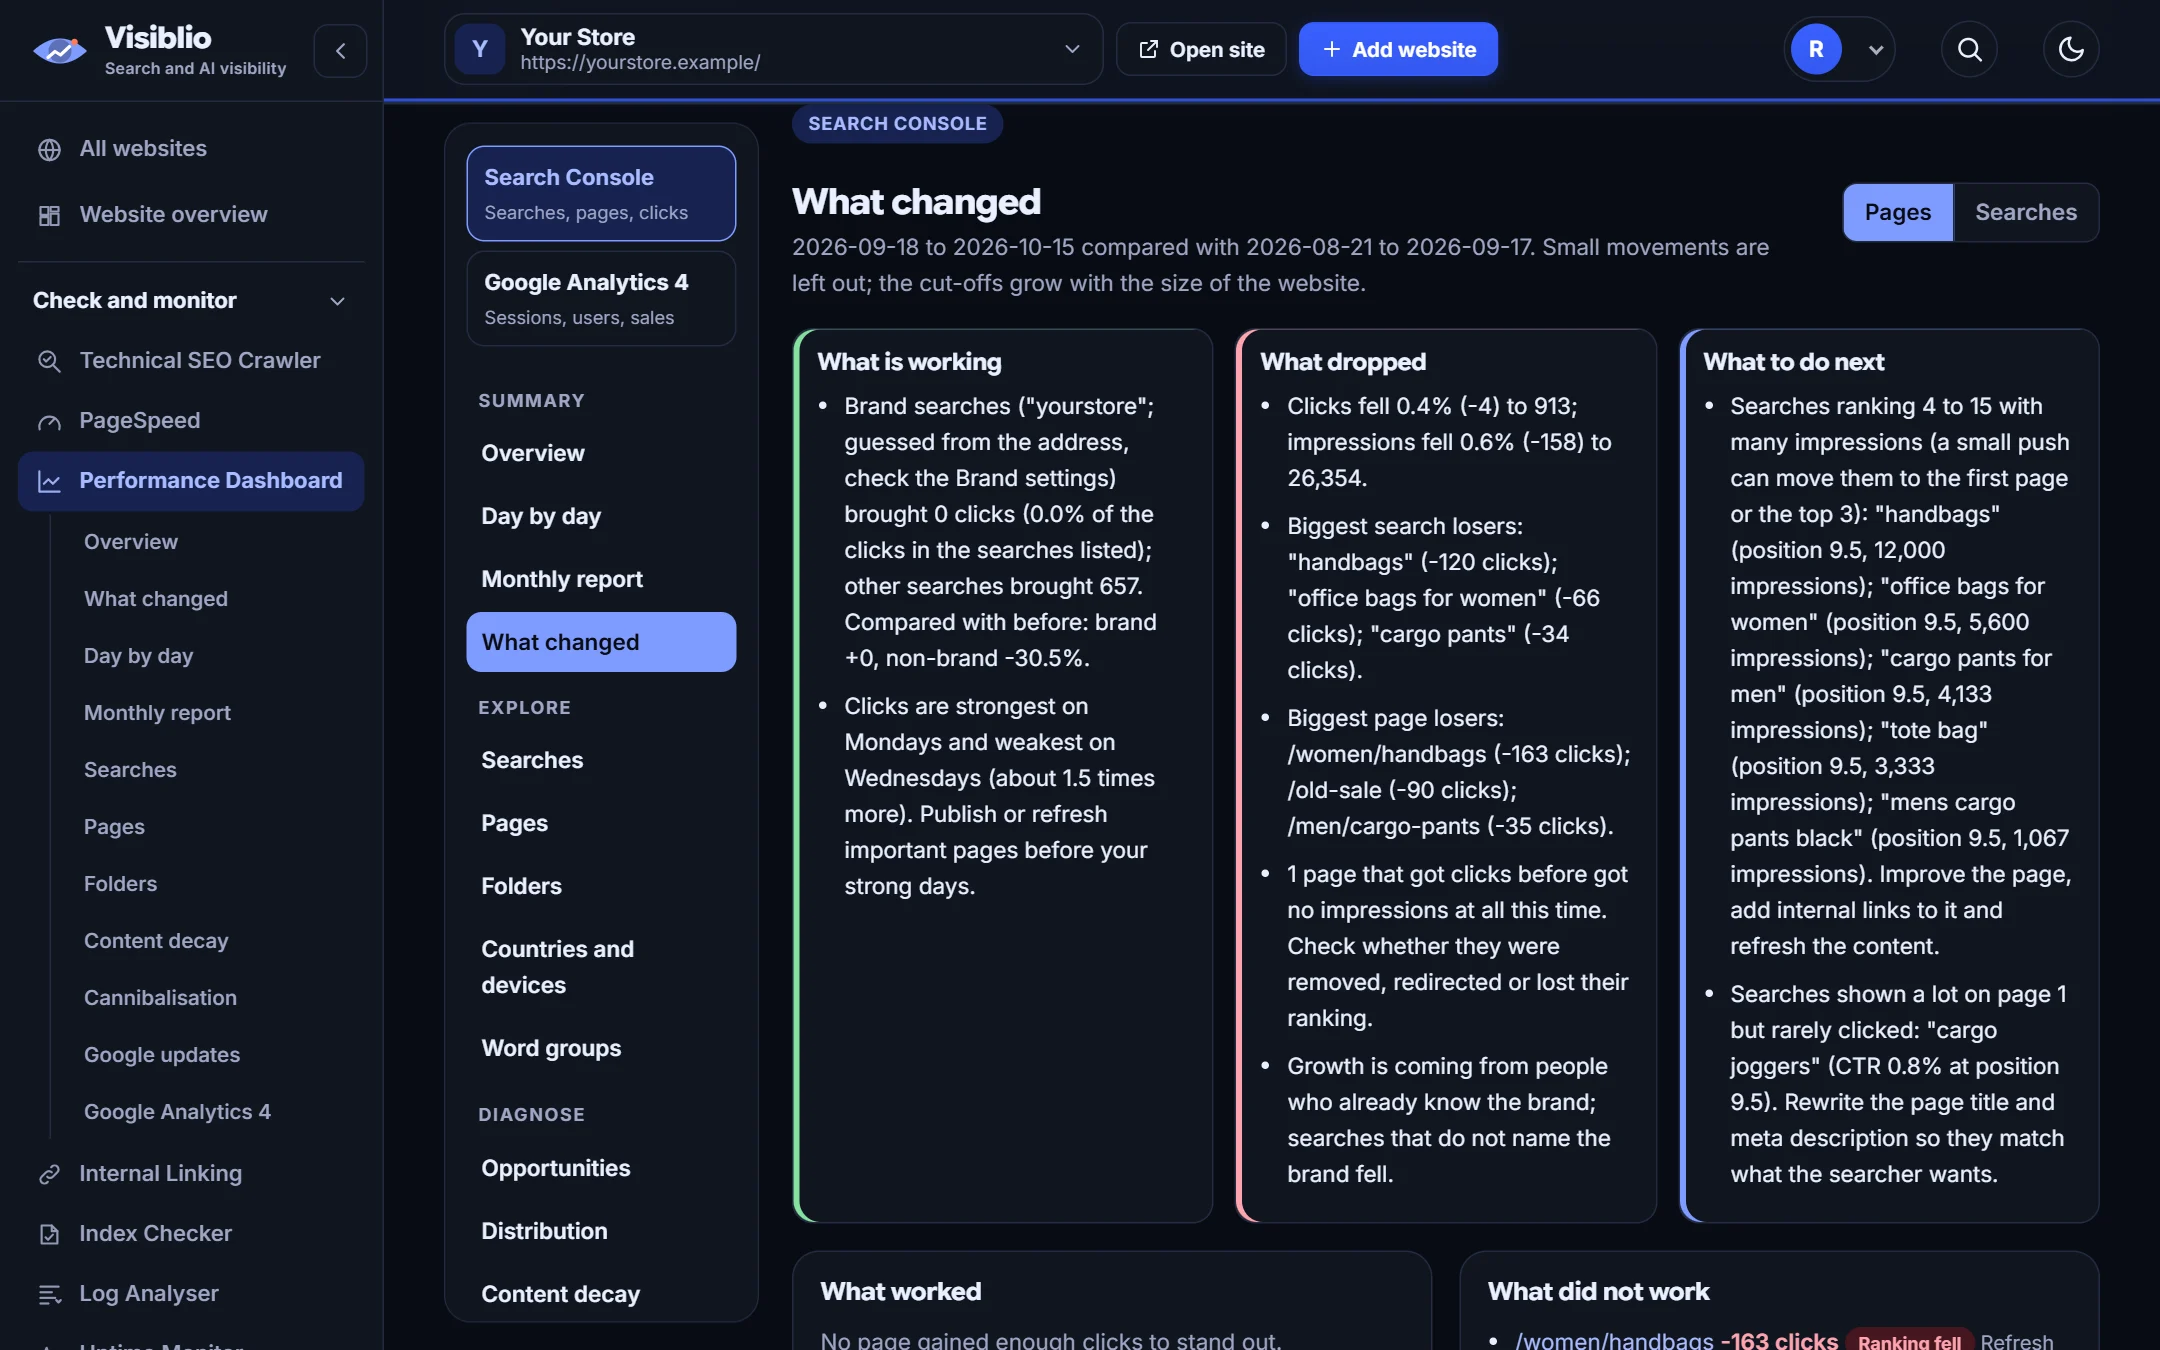
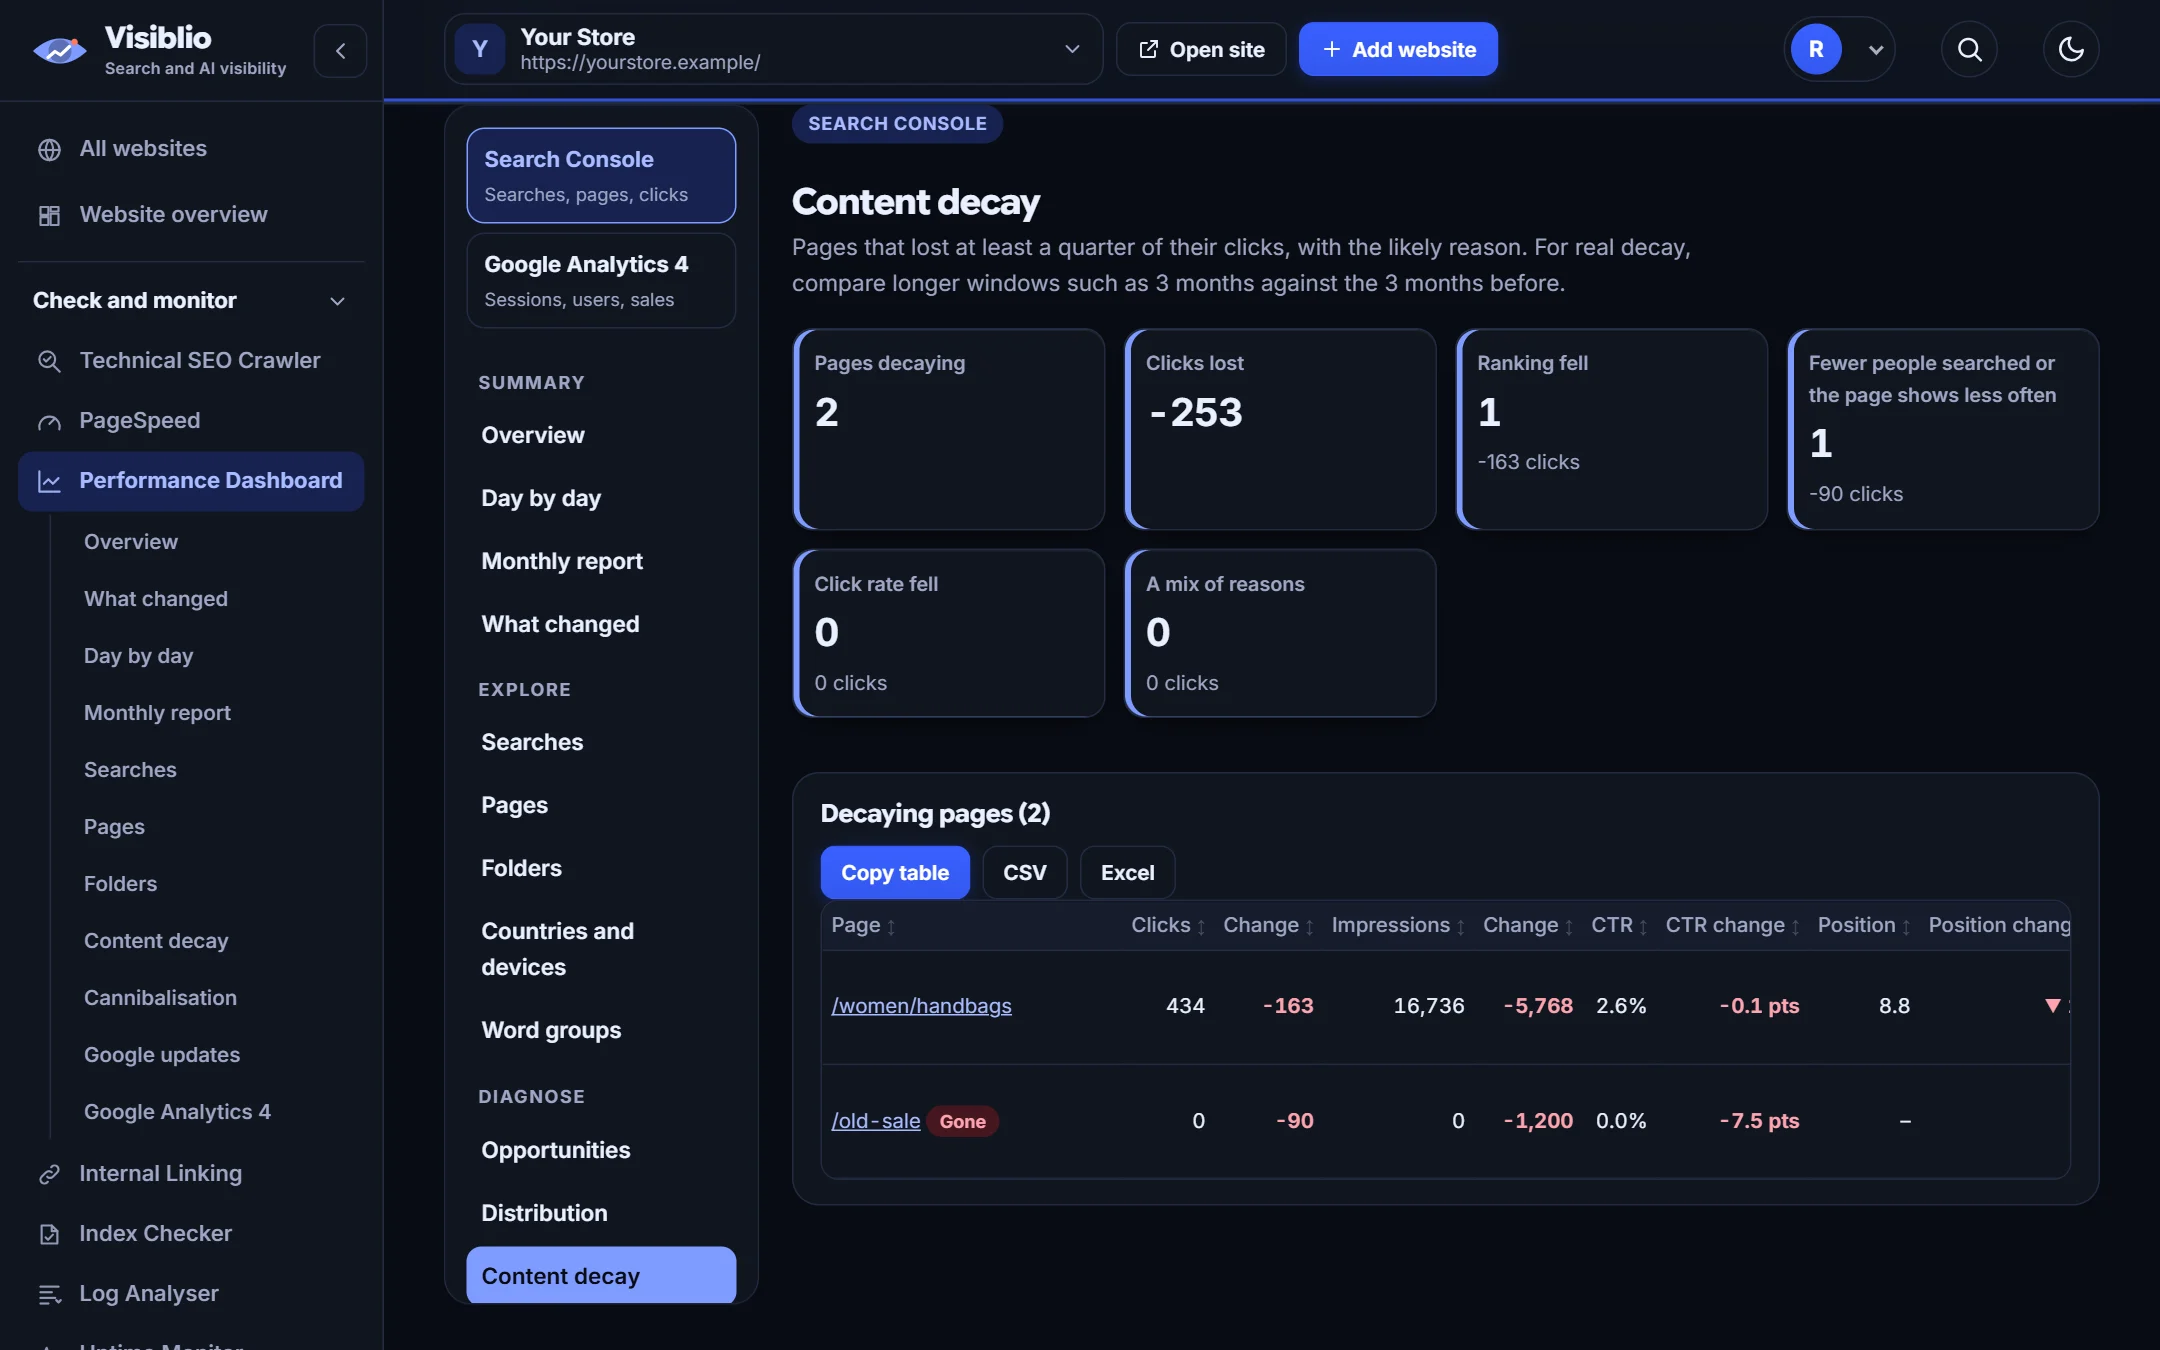
Pages and searches that lost clicks, and those that gained.
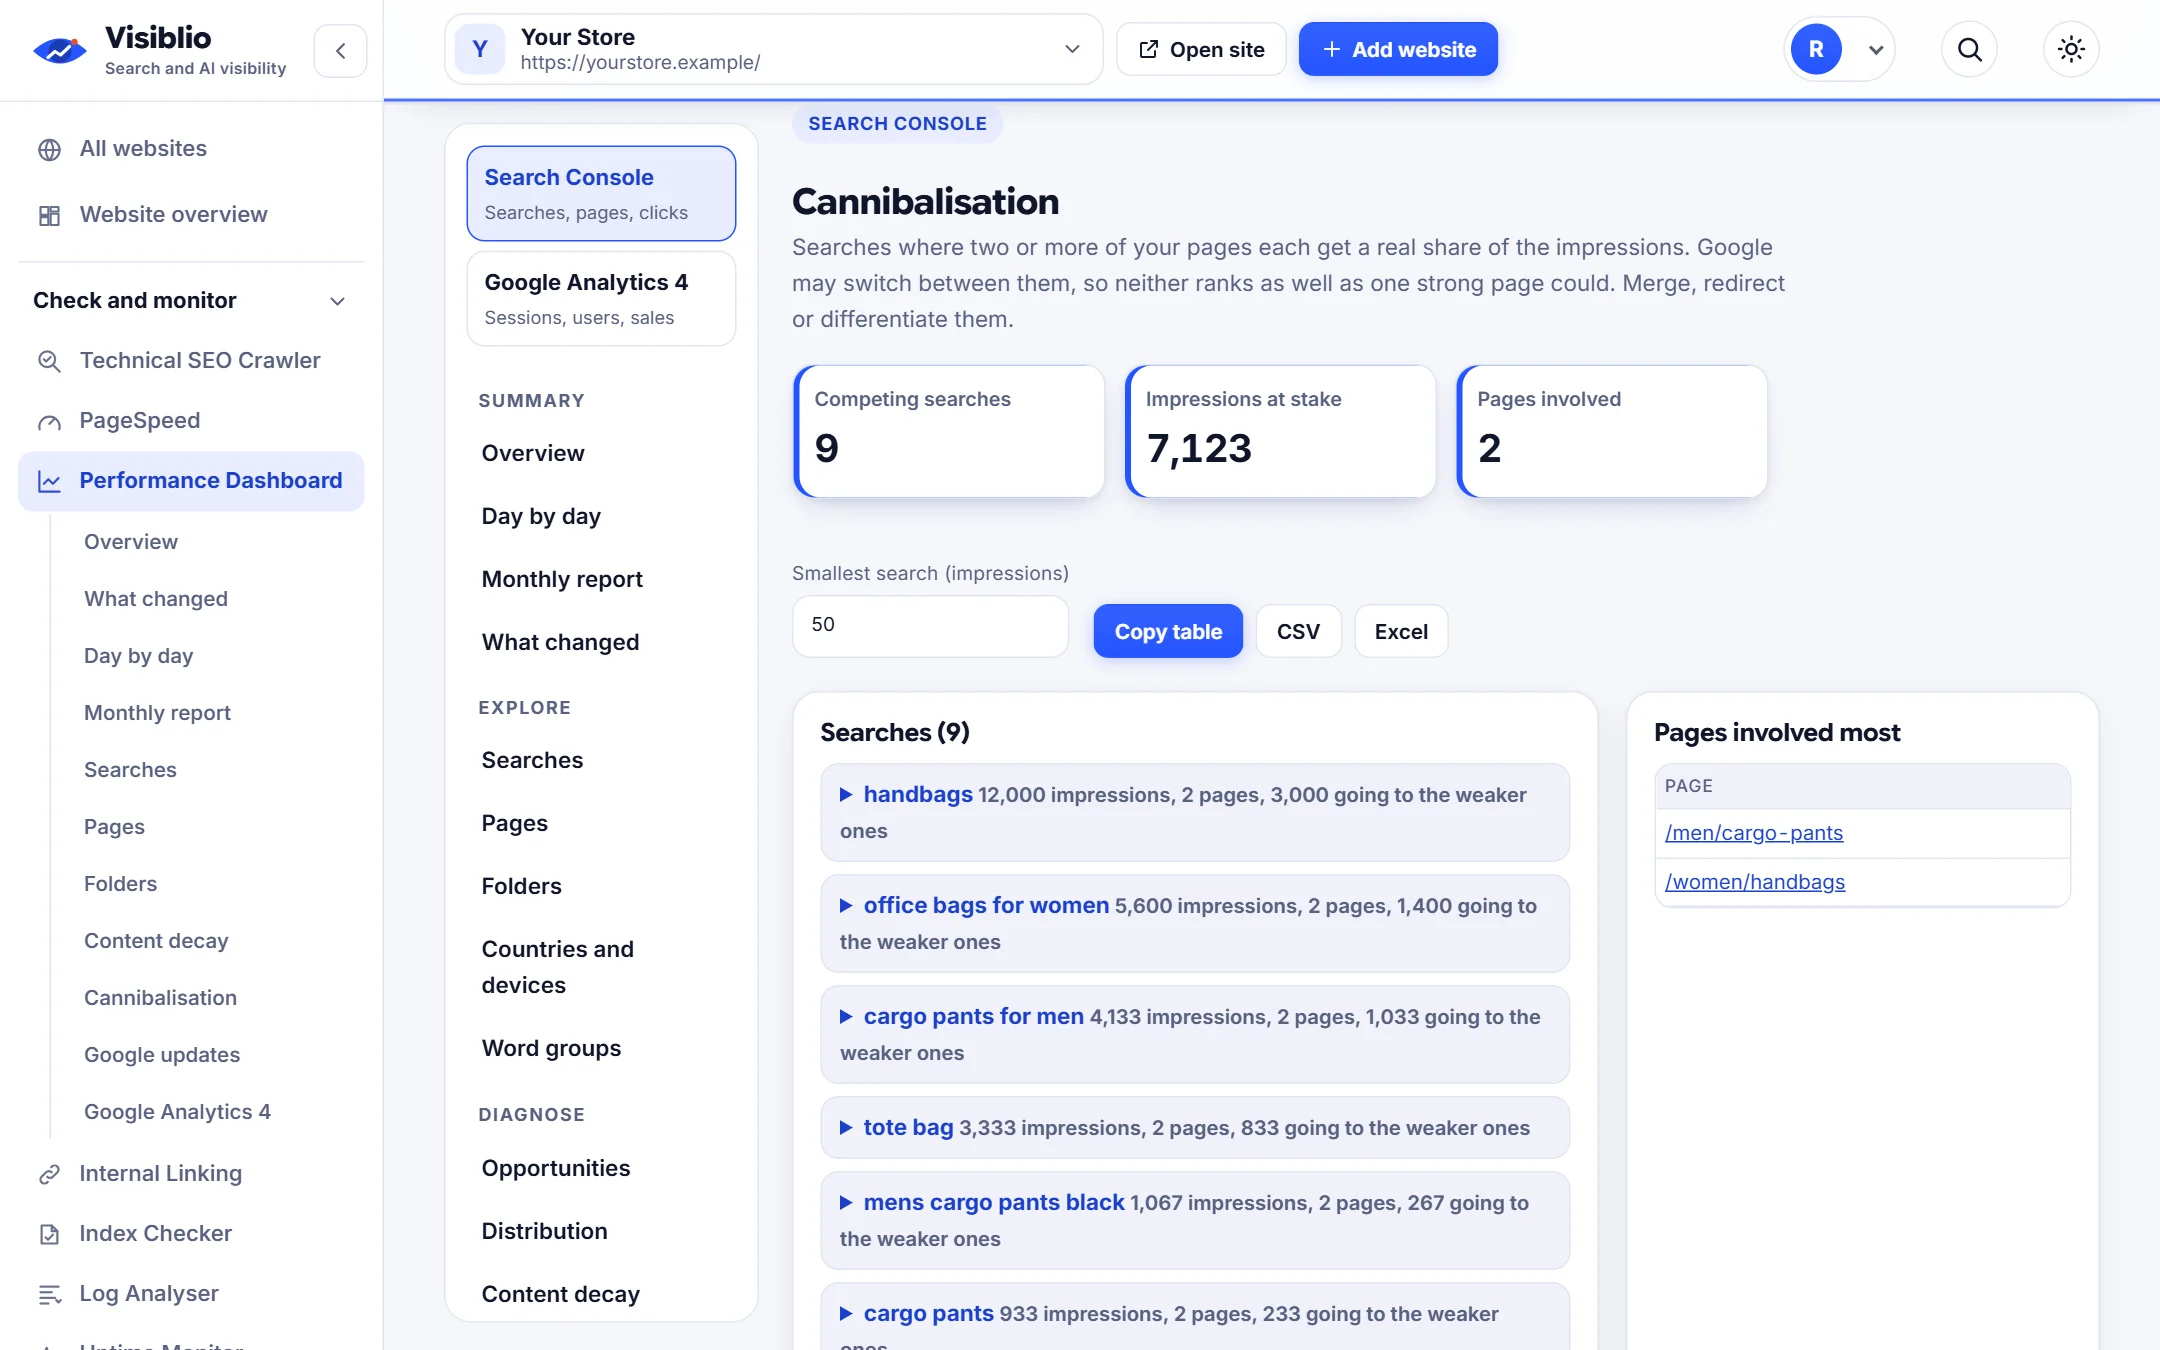
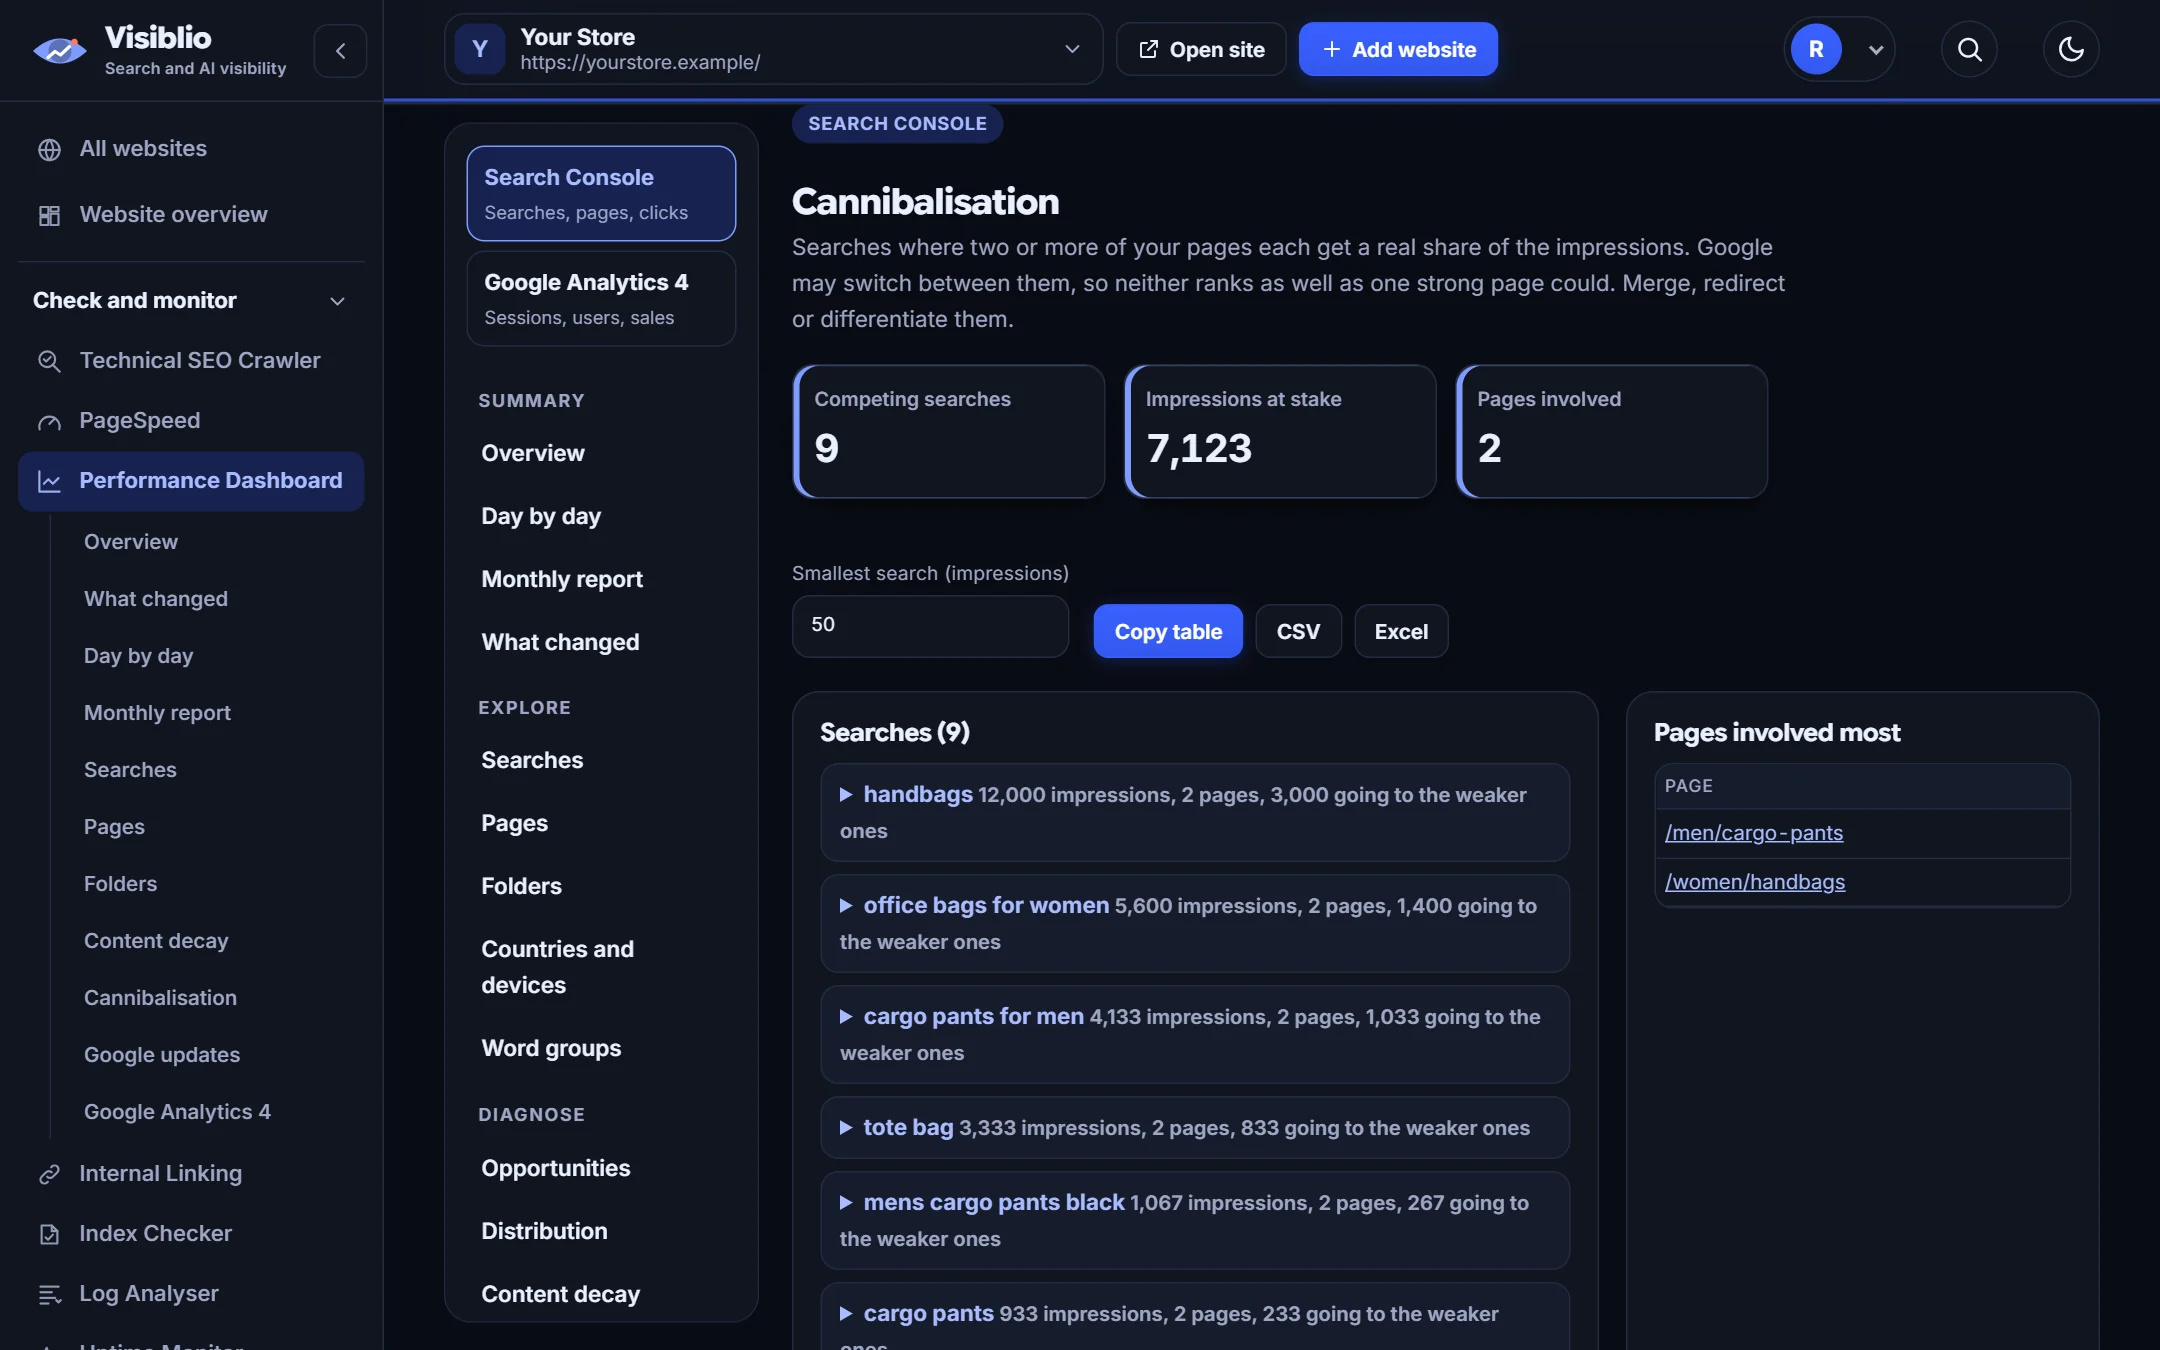
Find pages losing traffic over time and pages competing.
See whether a change followed a Google update.
Totals and changes are written in words, then shown on charts that keep the same size so they are easy to compare.

Lists of pages and searches that gained or lost, with decay and cannibalisation views.

Google updates are marked and their impact is estimated from your own clicks, and revenue sits beside the search data.

Connect Search Console and, optionally, Google Analytics, read-only.
Compare any two date ranges.
Open the pages that changed and fix or refresh them.
Report on performance without exporting data.
See search traffic and revenue together.
Show clients what changed and why.
| What you need | By hand | With Visiblio |
|---|---|---|
| Two tools | Switch between Search Console and Analytics | One dashboard |
| Finding losers | Export and sort | Listed for you |
| Updates | Check a calendar | Marked on the chart |
| Reporting | Screenshots | Copy tables and share |
A Search Console dashboard presents your Google Search data, clicks, impressions, click-through rate and position, in charts and tables so you can see trends and what changed.
Yes. Connect Google Analytics, read-only, and sessions, channels, landing pages and revenue appear beside the search data.
By default the data is shown on your screen and not stored. Only if a website manager switches on automatic tracking for a website are weekly snapshots kept, and Stop tracking removes them.
Yes. Known Google updates are marked on the charts, and their impact is judged from your own clicks before and after.
You can start for free. Your plan sets which tools are included.
Open the tool, add your website or a page address and see the result in minutes. It is free to start.